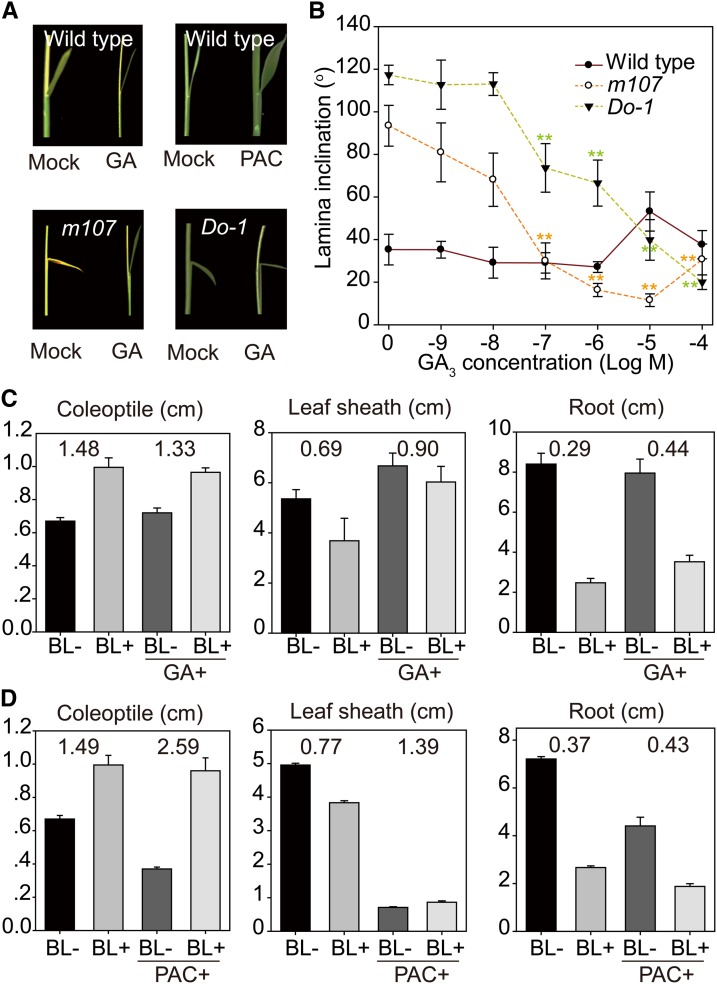
Figure 6.
(A) Lamina inclination of the second leaf in wild-type, m107, and Do-1 plants subjected to GA or PAC treatment.
(B) Responses of lamina inclination in the wild type, m107, and Do-1 to different GA concentrations. Error bars indicate sd (n = 10). Asterisks indicate P < 0.01 (**) in Student’s t test analysis.
(C) and (D) Effects of GA (C) and GA inhibitor (D) on BR sensitivity in various tissues. Length ratios of BL-treated and nontreated tissues were calculated and are shown.
Concentrations of 10−6 M GA, 10−6 M BR, and 10−5 M PAC were used for the treatments in (A), (C), and (D). Error bars indicate sd (n = 15).
[See online article for color version of this figure.]

