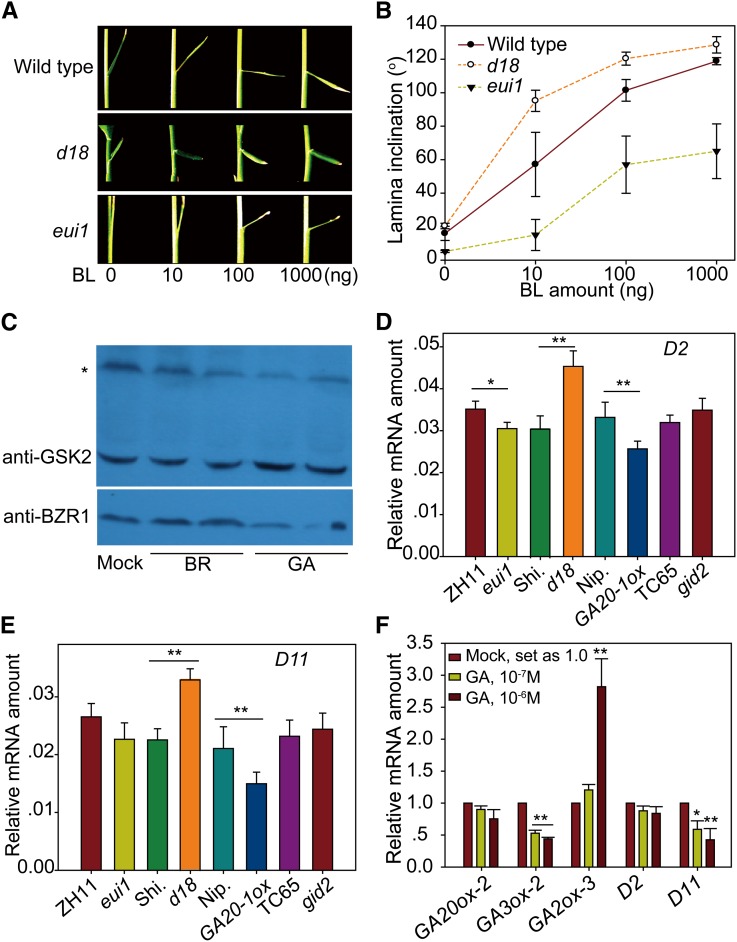
Figure 7.
GA Extensively Inhibits BR Signaling as Well as BR Biosynthesis.
(A) BR response of the wild type, d18, and eui1 in lamina inclination tests.
(B) Statistical analysis of the results shown in (A). Error bars indicate sd (n = 12).
(C) Detection of GSK2 and BZR1 by immunoblot analysis under 10−6 M BR and 10−5 M GA treatment. The asterisk marks an unspecific band that was used as a reference.
(D) and (E) Expression of D2 (D) and D11 (E) in GA-related mutant plants compared with their respective wild types. Error bars indicate sd (n = 3). Asterisks indicate P < 0.05 (*) and P < 0.01 (**) in Student’s t test analysis.
(F) Effects of GA treatment on the expression of GA and BR metabolic genes. Error bars indicate sd (n = 3). Asterisks indicate P < 0.05 (*) and P < 0.01 (**) in Student’s t test analysis.

