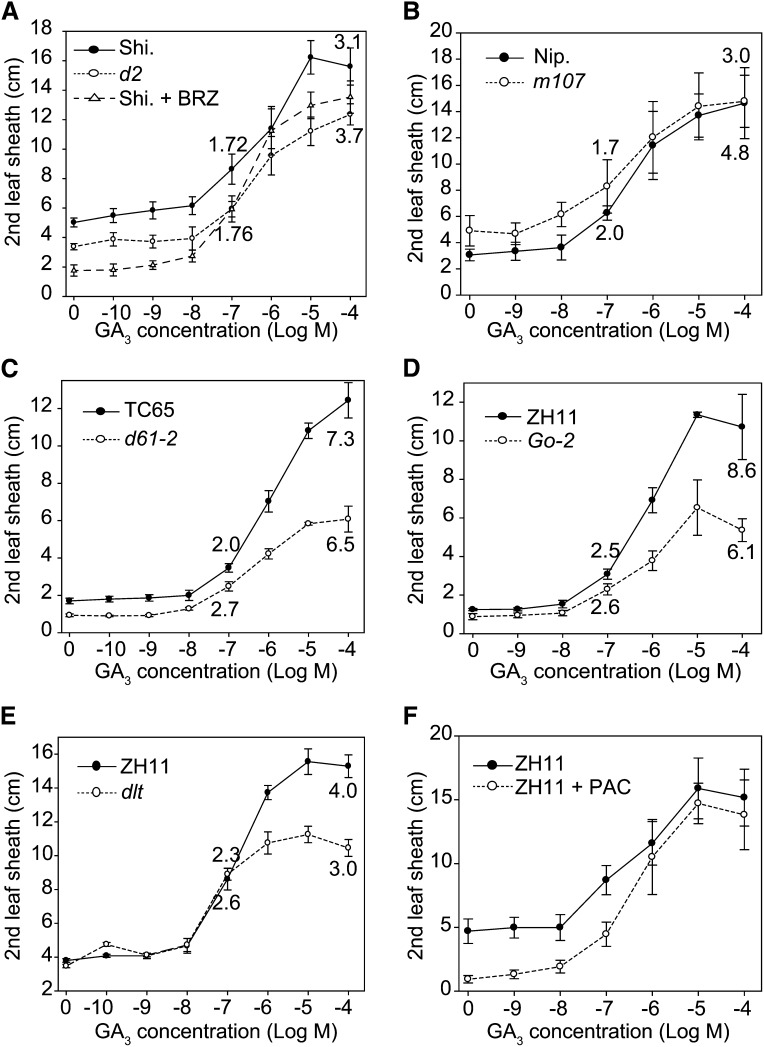
Figure 8.
Responses of BR-Related Mutants to Different Concentrations of GA.
Plants are as follows: d2 and BRZ-treated plants (A), m107 (B), d61-2 (C), Go-2 (D), dlt (E), and PAC-treated plants (F). The elongation ratios of the leaf sheath lengths between GA-treated and nontreated leaves were calculated and are shown. Error bars indicate sd (n = 10).

