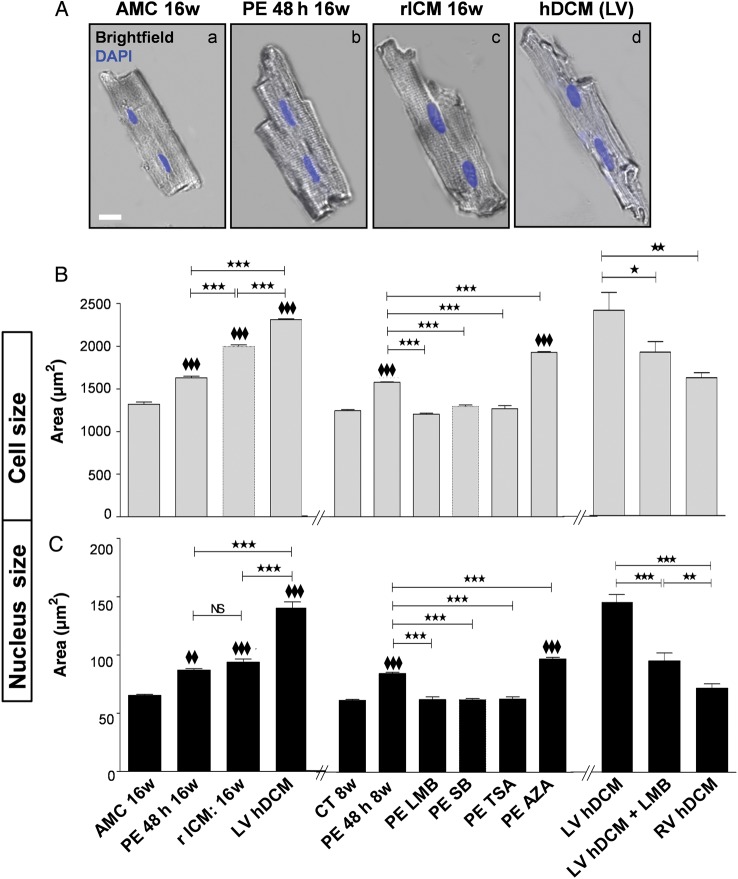
Figure 1.
Increase in cell and nuclei sizes in PE-treated adult rat CMs. Failing rat and LV human CMs have similarly increased sizes. (A) Representative merged brightfield images with nuclei stained with DAPI (blue) showing 16w AMC healthy rats' CM: AMC 16w (a) treated with PE: PE 48 h 16w (b), failing rat CM: rICM 16w (c), and failing LV human CM: hDCM (d). Scale bar represents 20 μm. (B) and (C) Bar graphs (left and right sides) showing cell size (B) and nuclear size (C) in healthy AMC 16w rat CM in culture for 48 h (AMC 16w) and in healthy 16w AMC rat CM exposed to PE (PE 48 h 16w), as well as in failing rat CM (16w MI) and failing human RV and LV CM from hDCM in the absence or presence for 4 h to LMB. Bar graphs (middle) showing cell size (B) and nuclear size (C) in healthy rat CM in culture for 48 h (CT 8w) and in healthy rat CM exposed to PE (PE 48 h 8w) in the absence or presence for 48 h of SB, TSA, LMB (4 h only), and AZA. Results are expressed in area (µm2) and shown as mean ± SEM (N = 4–5 animals; n = 3 experiments/animal). NS: non-significant; *P < 0.05, ♦♦ and **P < 0.01, ♦♦♦ and ***P < 0.001; ♦♦ or ♦♦♦ are vs CT8w or vs AMC 16w.

