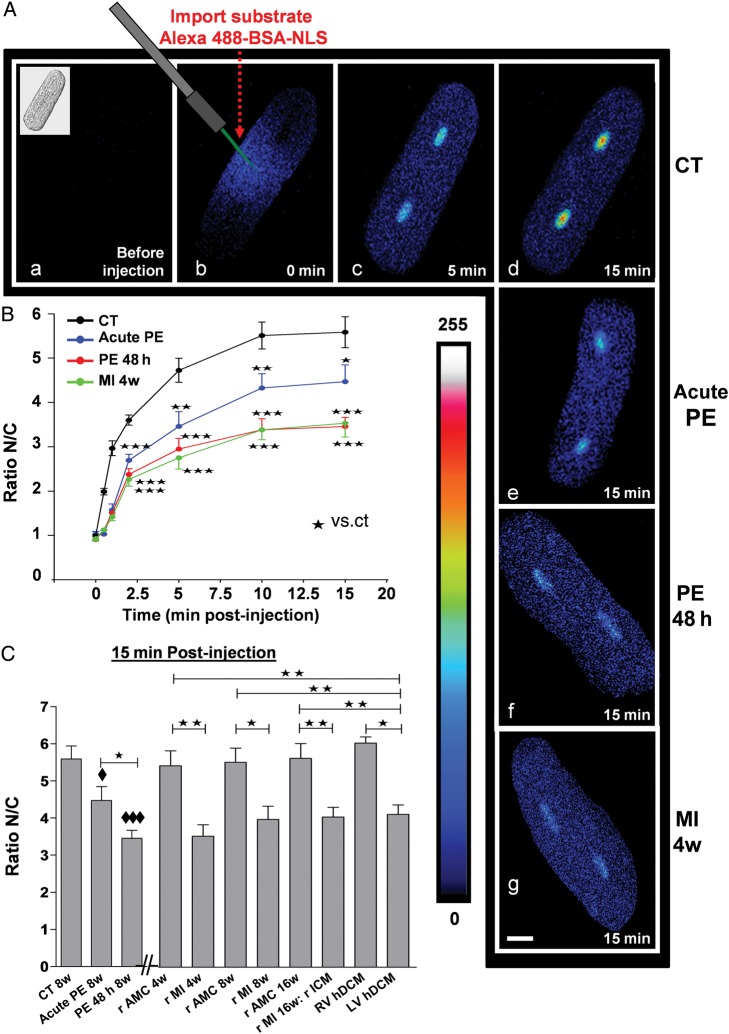
Figure 2.
NPI in live CM. Effect of shorter and longer PE treatment on adult rat CM to decrease NPI. Comparison with CM from failing rat (MI 4, 8, and 16 weeks) and CM from LV failing human hearts (hDCM). (A) Representative confocal images of adult rat CM microinjected with an import substrate following a shorter (acute PE: for 15 min) (e) or a longer exposure to PE (48 h) (f) or in failing rat CM (4w MI) (g) or in control cells (a–d). Images were taken at 0 min pre-injection accompanied with a brightfield image of the CM (upper left corner) (a), 0 min post-injection (b), 5 min post-injection (c), and 15 min post-injection (d). (e–h) were taken at 15 min post-injection. The pseudocolour scale represents fluorescence intensity levels from 0 (black colour) to 255 nm (white colour). The white size scale bar is 20 μm. Laser scanning settings are identical for all cells and experiments. (B) The curves summarize the NPI in CM exposed to the same conditions as in (A). (C) The bar graph summarizes the NPI in rat CM (CT 8w) and in CM exposed for a short (acute PE 8w) and a long (PE 48 h 8w) period to PE or untreated CM from 4w, 8w, 16w rMI, and their respective AMC (4w, 8w, and 16w), LV and RV hDCM at 15 min post-injection (C). Values are means ± SEM (N = 4 animals; n = 4–10 cells/animal). ♦ and *P < 0.05, **P < 0.01, ♦♦♦ and ***P < 0.001; ♦ vs. CT 8w.

