Figure 7.
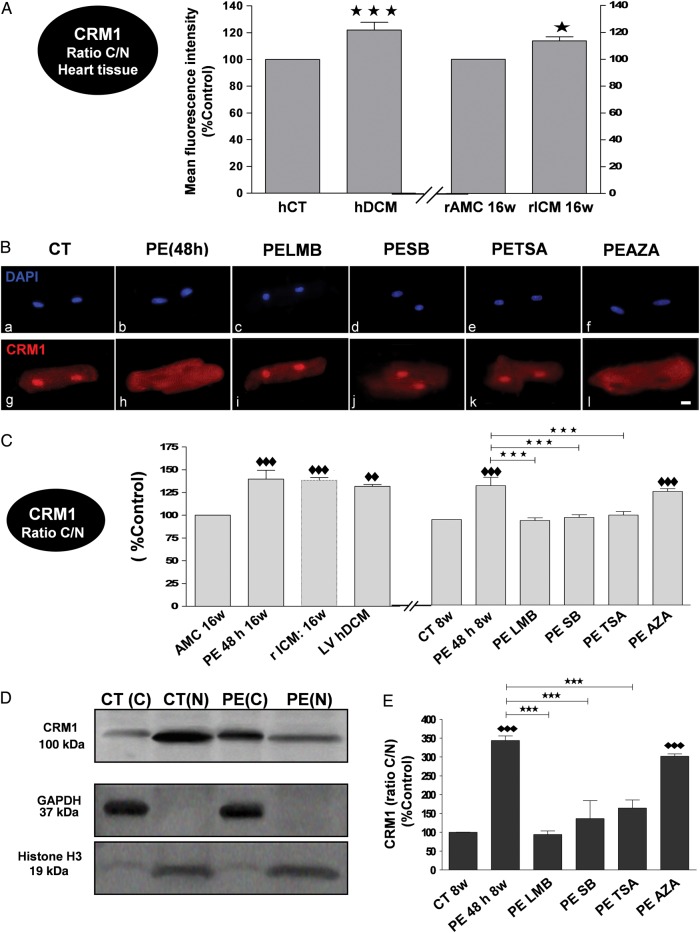
Increase in CRM1 export in PE-treated adult rat CM through p38 MAPK, HDAC II, and CRM1, but not GSK-3β, pathway(s). Failing rat and human CMs and ventricular tissue (VT) have similarly altered levels. (A) Bar graphs showing the ratio C/N mean fluorescence intensity (%Control) of CRM1 in control (hCT: white bar) and failing (hDCM: red) human VT and in control (rat age-matched control: rAMC: white bar) and failing (rICM: red bar) rat VT (N = 4 hearts; n = 3 experiments/heart). (B) Representative IF confocal images of rat CM stained with DAPI (blue; a–f) and CRM1 antibody (red; g–l) in rat control CM (CT 8w) (a, g), or in rat control CM exposed to PE (PE 48 h 8w) in the absence (b, h) or presence of inhibitors. The white size scale bar is 20 μm. (C) Bar graphs showing mean fluorescence intensity levels (%Control) of CRM1 in AMC 16w rat CM and MI 16w rat CM (rICM), and hDCM, as well as in rat control CM (CT 8w) exposed to PE (PE 48 h 8w) in the absence or presence of inhibitors (N = 4–5 hearts; n = 3 experiments/heart). Representative western blots (D) and analysis by densitometry (%Control) of CRM1 expression (E) in the nuclear and cytosolic fractions of rat adult CM exposed to PE (48 h) in the absence (D and E) or presence of inhibitors (E). All results are shown as mean ± SEM. *P < 0.05, ♦♦P < 0.01, ♦♦♦ and ***P < 0.001; ♦♦ or ♦♦♦ are vs CT8w or vs AMC 16w.

