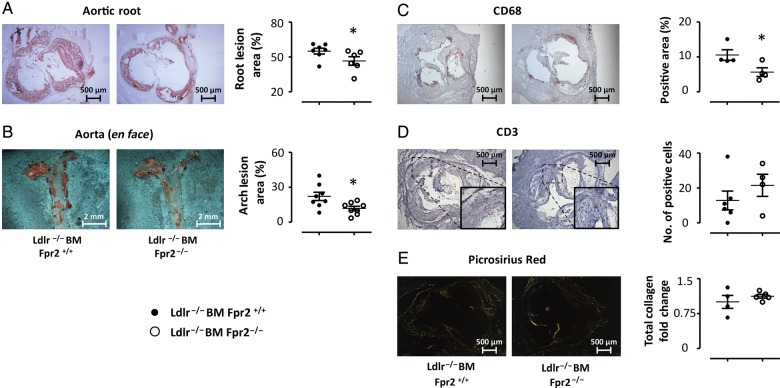
Figure 4.
Atherosclerotic lesion size in aortic roots (A) and aortic arch (B) derived from Ldlr−/− mice receiving BM from either Fpr2+/+ (Ldlr−/−BM Fpr2+/+, closed circles, N = 8) or Fpr2−/− (Ldlr−/−BM Fpr2−/−, open circles, N = 8) donors. Tissue was collected after 20 weeks of HFD. Representative micrographs are also shown on top. The plaque composition of the aortic roots in terms of CD68 and CD3 is shown in (C and D). For Picrosirius red collagen staining, each symbol represents the average of at least four sections derived from each mouse expressed as fold change relative Ldlr−/−BM Fpr2+/+. Representative micrographs of each staining are also shown. Results are expressed as mean ± SEM for the indicated units. *P < 0.05.

