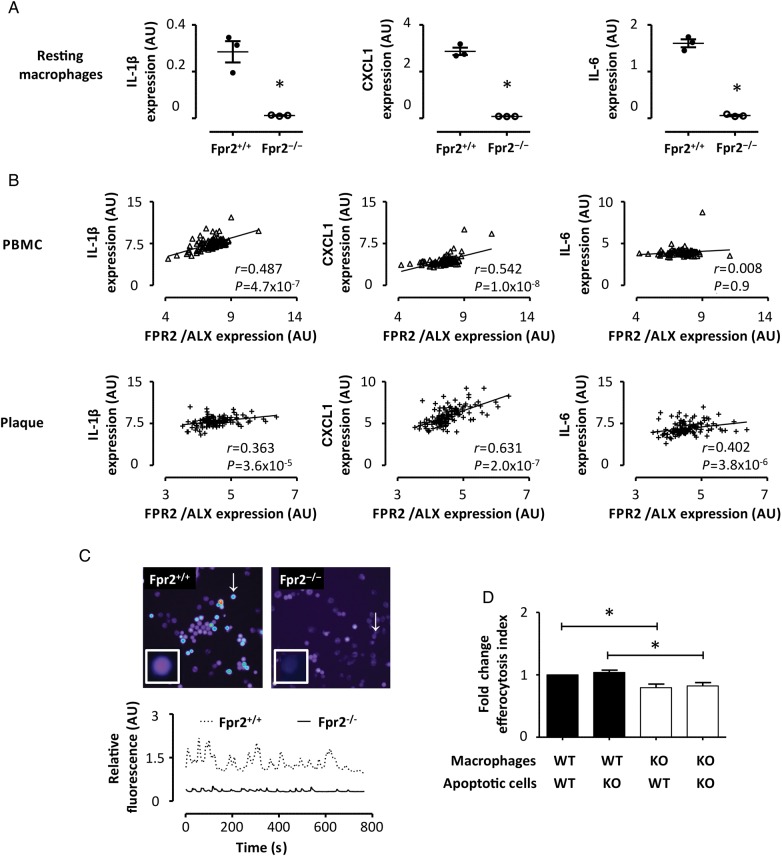
Figure 5.
(A) The results of real-time PCR for IL-1β, CXCL1, and IL-6 expression in peritoneal macrophages derived from either Fpr2+/+ (close circles) or Fpr2−/− (open circles). Each symbol represents three different experiments using pooled samples from three mice. (B) The correlations of FPR2/ALX mRNA levels with the respective cyto/chemokine mRNA in peripheral blood monocytic cells (PMBC, n = 98) and atherosclerotic lesions (n = 127) derived from patients undergoing carotid endarterectomy. In (C), representative tracings of calcium oscillations in peritoneal macrophages from Fpr2+/+ (dotted line) and Fpr2−/− (continuous line) are shown. These tracings represent the oscillations in the respective cells marked with a white arrow in the right panels, and can be visualized in Supplementary material online, Videos S1 and S2, respectively. (C) The uptake of apoptotic splenocytes by peritoneal macrophages (1 : 2 ratio efferocyte : apoptotic cell), derived from either Fpr2+/+ (black bars) or Fpr2−/− (white bars) mice. Results (mean ± SEM) are expressed as fold change compared with Fpr2+/+ macrophages; n = 5. *P < 0.05.

