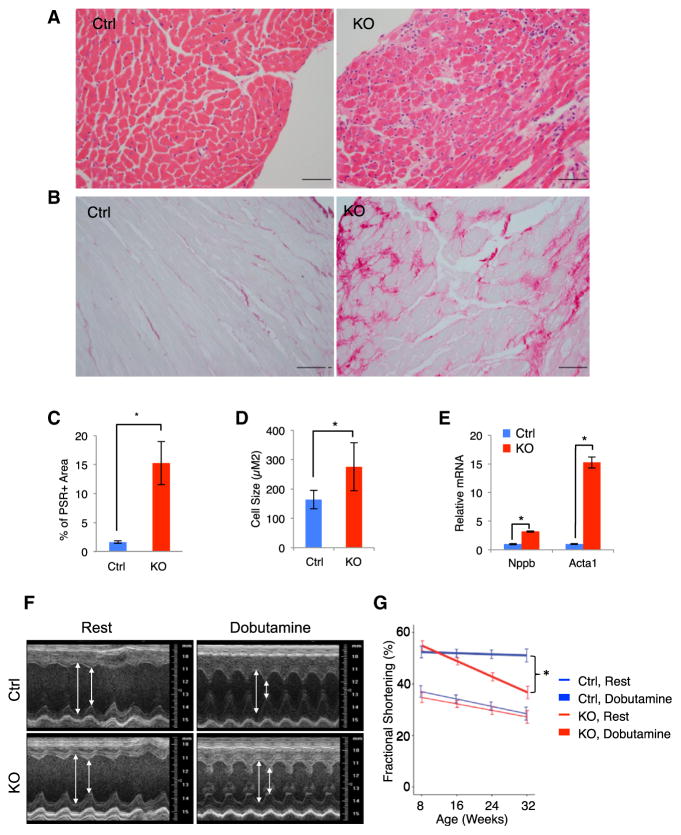
Figure 1. NELF-B KO Leads to Cardiomyopathy.
(A) Hematoxylin and eosin staining of left ventricles from control (Ctrl) and NELF-B knockout (KO) mice. The scale bar represents 50 μm.
(B) Picrosirius red staining for collagen deposition. The scale bar represents 50 μm.
(C) Quantification of picrosirius red staining (n = 5). Here and elsewhere in the figures, *p < 0.05. Error bars represent SEM.
(D) Quantification of cell size of over 100 individual cardiomyocytes (n = 3).
(E) Relative mRNA levels of two hypertrophy markers (n = 6).
(F) Representative left ventricular M-mode echocardiography. The double-headed arrows indicate the left ventricular dimension at diastole (longer arrow) and systole (shorter arrow)
(G) Fractional shortening from the left ventricle (LV) at rest (thin lines) and following dobutamine injection (thick lines). Ctrl: n = 11; KO: n = 8.

