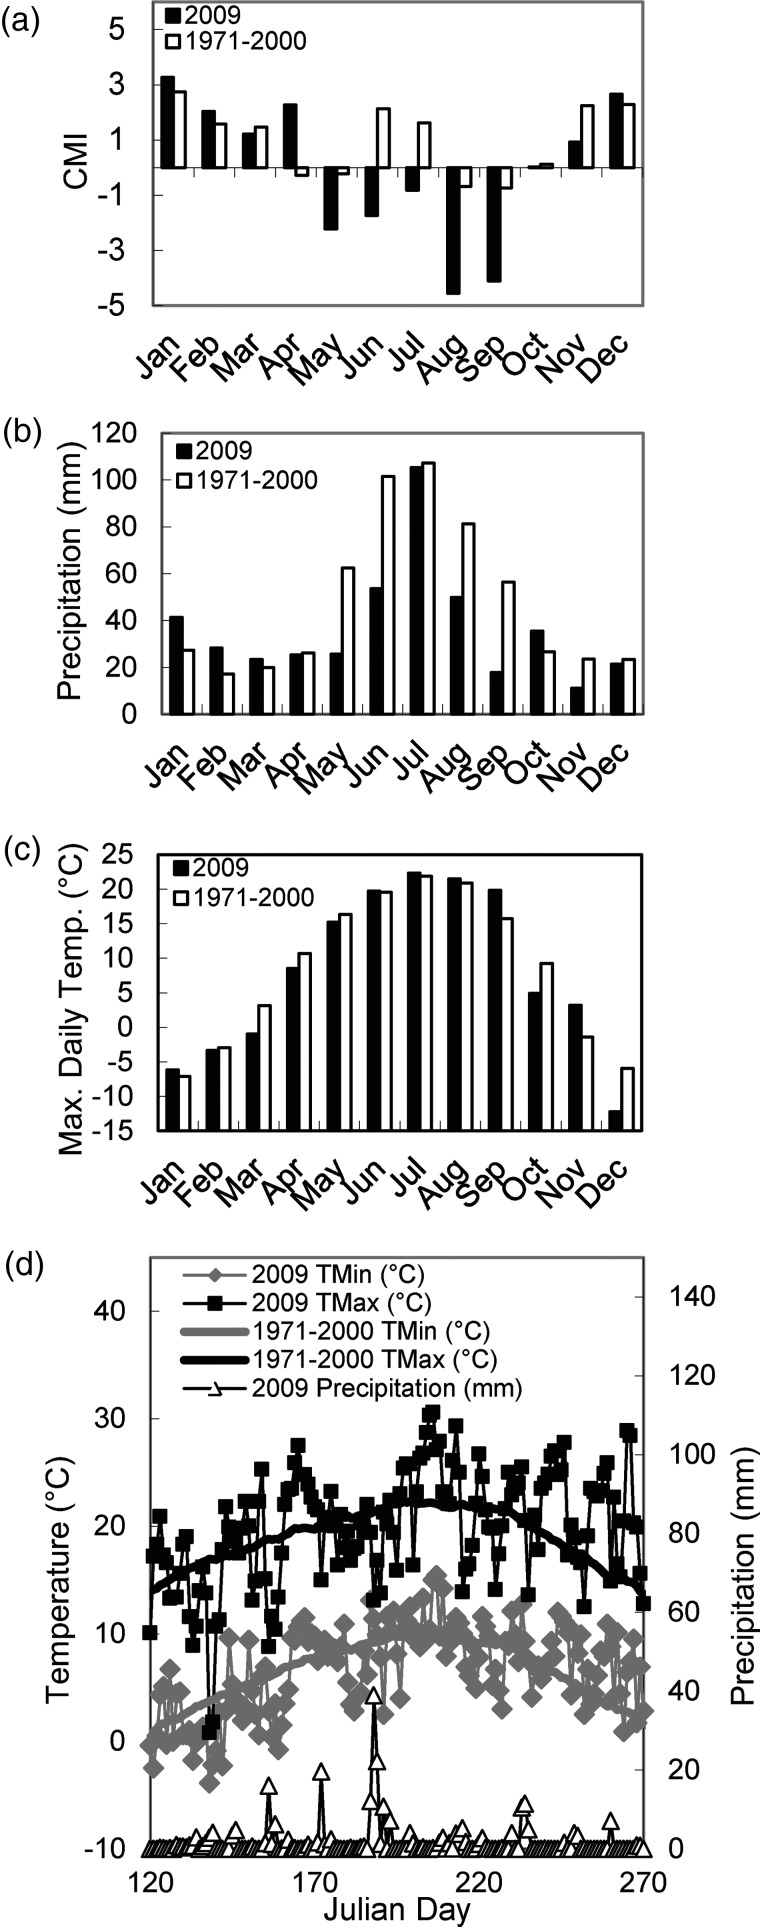
Figure 2.
Comparison of 2009 to 1971–2000 average monthly and daily environmental data for the study site district. Data were obtained from Environment Canada's Whitecourt weather station, ∼37 km from the study site. (a) Climate Moisture Index calculated on a monthly basis for 2009 and the 1971–2000 average. Negative CMI values indicate a predicted moisture deficit. (b) Precipitation expressed as a monthly average, (c) maximum daily temperature expressed as a monthly average, (c) climate moisture index using the average of 1971–2000 and recorded data from 2009 in Whitecourt (AB). (d) Minimum and maximum temperature and precipitation averaged for 1971–2000 and the year of 2009. In a–c, black bars illustrate 2009 data, and white bars illustrate 1971–2000 data. In d, gray diamonds indicate daily temperature minima for 2009, black squares indicate daily temperature maxima for 2009, the gray thick line indicates average daily temperature minima for 1971–2000, the black thick line indicates average daily temperature maxima for 1971–2000, and white triangles indicate 2009 daily precipitation.

