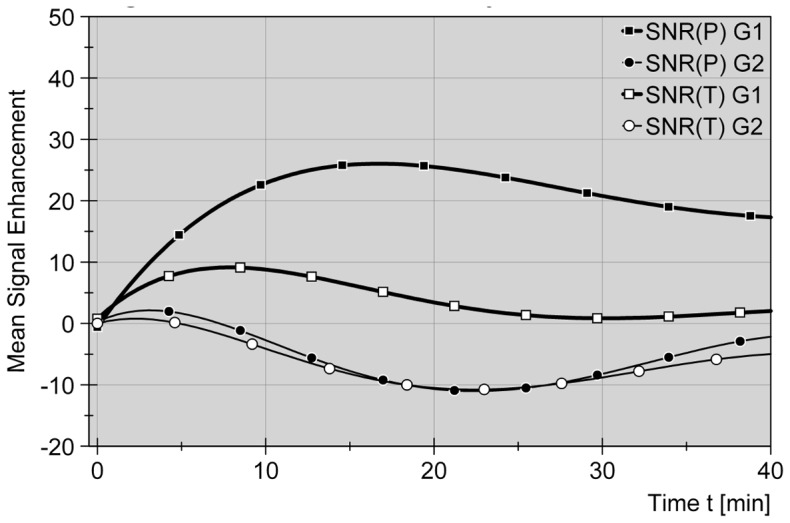
Figure 1. Comparative signal alteration for liver parenchyma and target tumors in group 1 (Gd-EOB-DTPA) and group 2 (non-contrast).

Signal-to-noise ratios (SNR, delta values) are displayed as a function of time after bolus injection of Gd-EOB-DTPA (0.025 mmol/Kg i.v.) in group 1 and start time in group 2. Standardized curves are compensating 5th grade polynomial functions. A rapid contrast uptake in group 1 (G1) leads to an enduring signal elevation in liver parenchyma (P) during catheter placement phase (–▪–). Values in group 2 (G2) are oscillating around zero as non-contrast signals are not significantly altered (–•–). Contrast-induced tumor (T) signal increase appears in the early extracellular phase (<10 minutes), while the curve (–□–) is approximating zero and non-contrast values (–○–) thereafter. As a consequence the graph displays a favorable gap between PG1 and TG1 on the one hand and PG1 and both PG2 + TG2 on the other hand.
