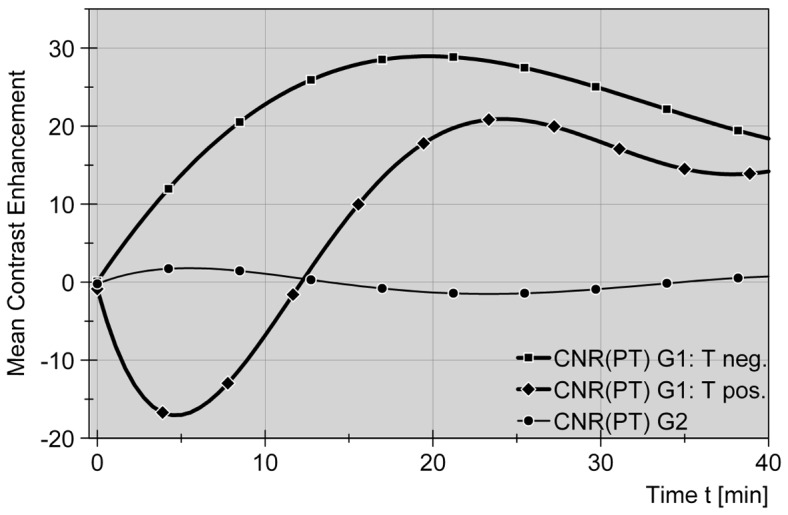
Figure 2. Liver-to-tumor contrast in dependence of Gd-EOB-DTPA application on the one hand and absence or presence of early phase tumor enhancement on the other hand.

Contrast-to-noise ratios (CNR, delta values) are displayed in the same manor as SNR curves in figure 1. While sharing the favorable increase in contrast between parenchyma (P) and target tumor (T) at late phase, enhancing (Tpos) and non-enhancing (Tneg) tumors in group 1 (G1) show different curve progressions in the early phase after bolus contrast. Reversion from negative to positive delta CNR values (–♦–) and traversing an early equilibrium is characteristic for enhancing tumors (TposG1) in the given setting.
