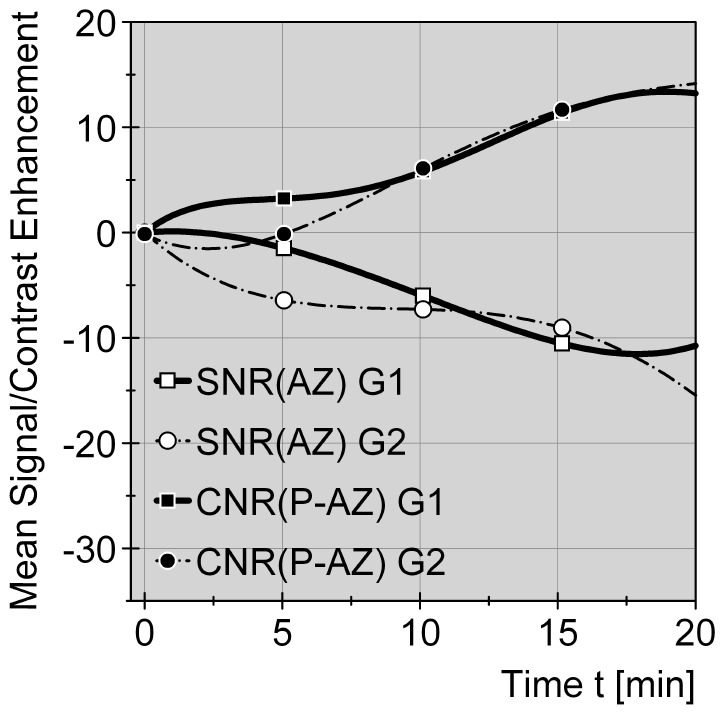
Figure 6. Comparative signal and contrast alterations for liver parenchyma and thermal impact zone in group 1 (Gd-EOB-DTPA) and group 2 (non-contrast) during therapy phase.

Ratios (SNR+CNR, delta values) are displayed as a function of time after technically starting an ablation cycle in group 1 (Gd-EOB-DTPA) and group 2 (non-contrast). Standardized curves are compensating 4th grade polynomial functions. Graphs show homogeneous decrease of SNR values within the thermal impact or ablation zones (AZ), consistent with temperature-induced T1 signal drop, in both groups 1+2 (G1, G2). At the same time CNR values (parenchyma P vs. AZ) increase for both groups in a parallel manor. It seams, thermometry monitoring is not influenced by Gd-EOB-DTPA application.
