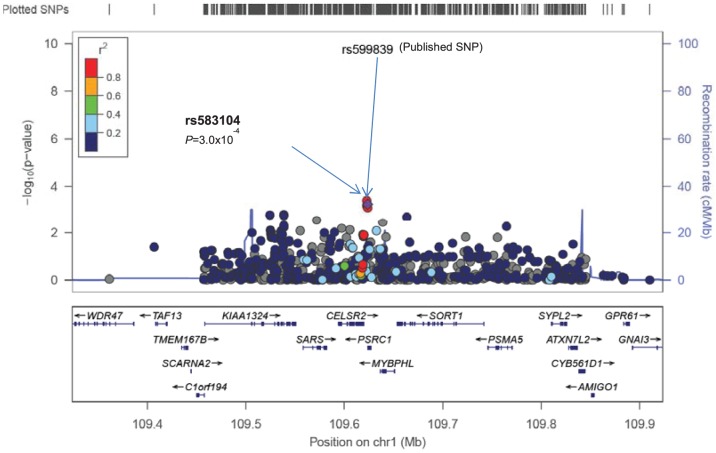
Figure 1. Regional plots of validated loci showing replication of the published SNP or proxy (a) or novel SNPs in known CHD loci (b, c).
The X-axis shows chromosomal positions and genes, the left Y-axis shows the –log10P-values and the right Y-axis shows the recombination rate across the region using HapMap CEU linkage disequilibrium. Plotted SNP is the published SNP and is marked by a purple diamond and an arrow.

