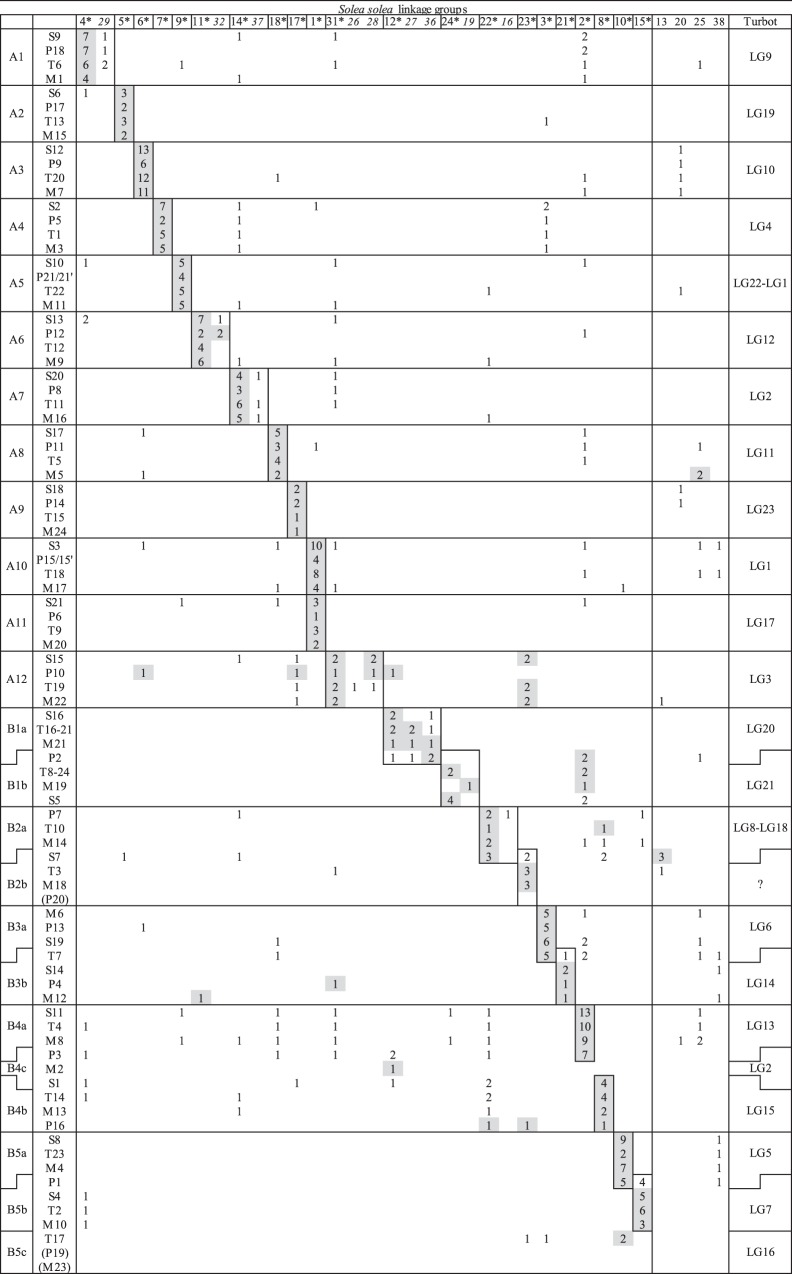
Figure 2. Syntenic relationships between sole and five other (flat)fish.
The chromosomes of four model fish species, namely stickleback (S), tilapia (T), pufferfish (P) and medaka (M), were grouped in A- and B-groups according to their syntenic relationships as described in Sarropoulou et al. (2008), Kai et al. (2011) and Guyon et al. (2012) (left column). The numbers in the grid indicate the number of contigs where sequence homology was found between the sole linkage groups and the chromosomes of the four model species. For each chromosome the sole linkage group with the largest number of homologous sequences is highlighted in grey. Marked with *: the 21 linkage groups that are suggested as chromosome counterpart for sole (or at least part of it). In italics: linkage groups likely to be on the same chromosome as the linkage group marked with * to the left of it. For all 21 putative sole chromosomes (except for LG23) a homologous turbot linkage group is suggested (right column).

