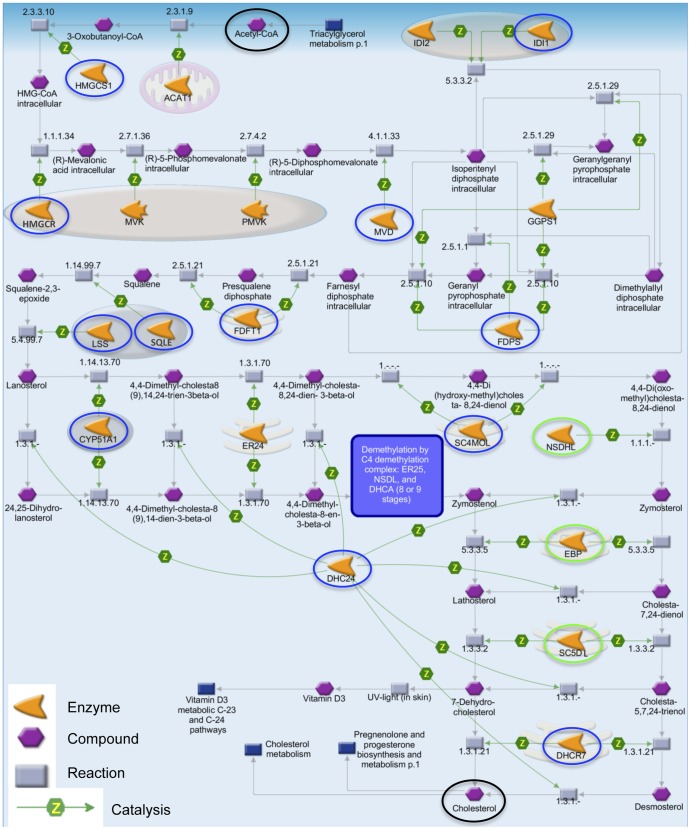
Figure 2. The cholesterol biosynthesis pathway.
Moderate alcohol consumption decreased expression of 15 genes throughout the cholesterol biosynthesis pathway. Blue circles denote genes with a fold change greater than −1.3, while green denote those less than −1.3. All enzymes (orange arrowheads) produced from these genes catalyzed (green arrows labeled Z) their respective chemical reactions (grey boxes) on their target compounds (purple hexagons). The first compound, Acetyl-CoA, and the last compound, Cholesterol, are denoted by black circles (top and bottom of figure, respectively). The figure also displays the cellular localization of the enzymes: the entire figure is found in the cytoplasm, pink ovals represent peroxisomes (e.g. IDI1), blue ovals are lysosomes (e.g. LSS), and pink stacks represent endoplasmic reticulum (e.g. FDFT1). Srebf1 and Srebf2, transcription factors that activate many of these genes, were both down-regulated (not displayed). Nine of these results were confirmed by qRT-PCR (Fig. 3A). Image modified from Thomson Reuter's MetaCore.

