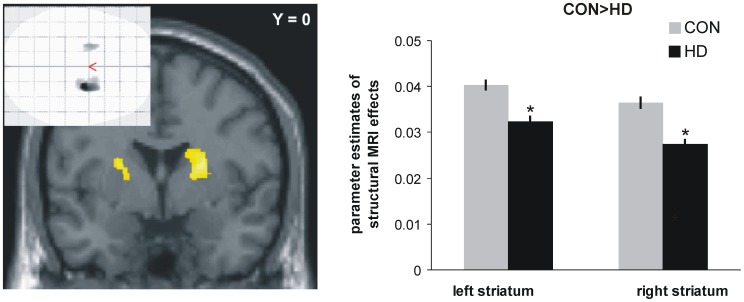
Figure 2. Comparison of structural grey matter images: decreased dorsal striatal volume in mutation carriers as compared to control subjects (*: p<0.001, uncorrected, number of voxels per cluster >20 for illustration purposes).
Glass brain figure shows regional specificity of the results. Bar graphs on the right side depict parameter estimates of structural MRI volume differences between HD subjects and healty controls obtained from the left striatal peak voxel (x/y/z = −24/2/15) and the corresponding voxel on the right side (x/y/z = 24/2/15). HD: Huntington disease mutation carriers, CON: control subjects.

