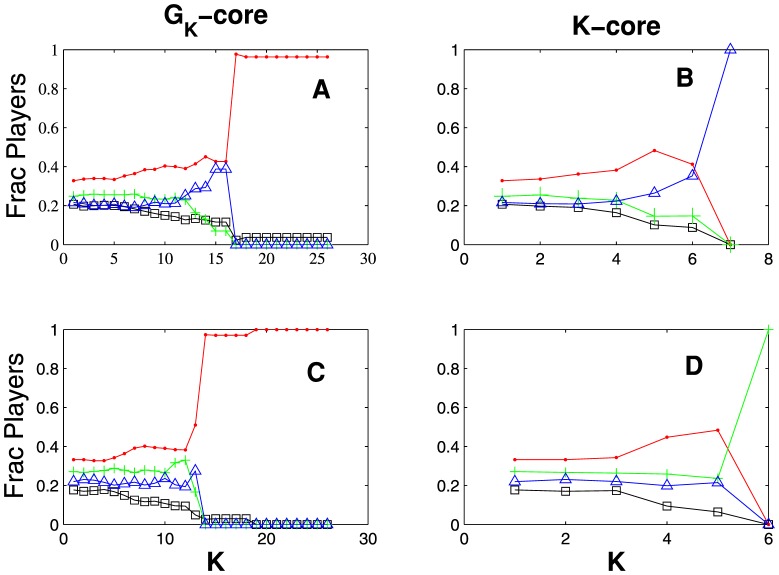
Figure 5. Sharp transitions at the core organization of social networks.
The value at  belongs to the composition of the society at the time period under study. On top a) we have the nation composition of the
  -core and c) the
  -core as a function of
  for the
  network corresponding to the period 796–856. At the bottom b) we have the nation composition of the
  -core and (d) the
  -core in terms of
  for the
  network corresponding to the period 1140-1200. Colours depict the different nations. As long as
  increases, the composition of the cores in terms of nationalities is more or less stationary, with values close to the ones we find in the whole system. At certain
  -right after the characteristic
  - an abrupt change is observed a) for the and
  ), and the composition of the cores becomes uniformly populated by only one nation. The same phenomenon is observed when looking at the
  -core decomposition sequence, although less pronounced. Notice that the deep
  -cores isolated the same nation cluster in both periods (the ‘red’ nation), whereas the
  -cores didn't.

