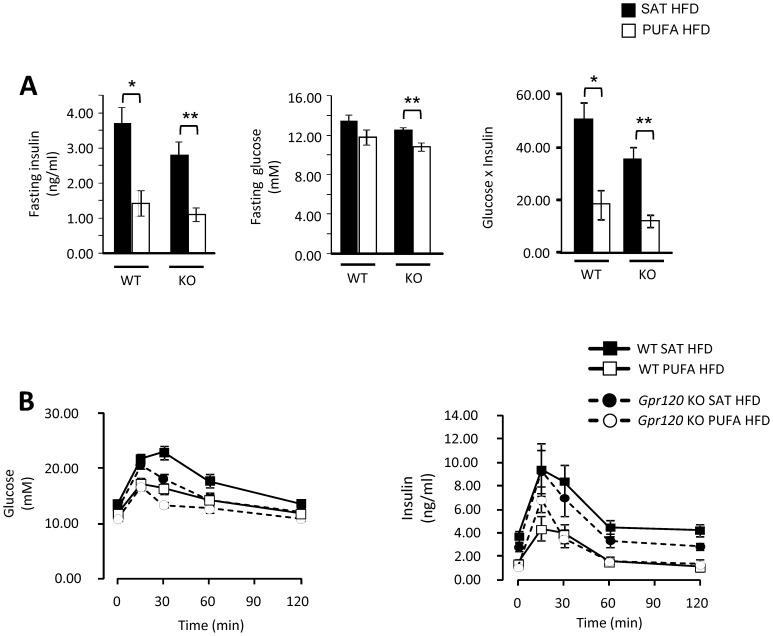
Figure 5. Oral glucose tolerance test.
A; Fasting blood insulin, glucose levels and insulin resistance index (glucose (mM) x insulin (ng/ml)) and B; oral glucose tolerance test in WT mice fed SAT HFD (n = 8, filled bars, filled square) or PUFA HFD (n = 8, open bars, open square) and in Gpr120 KO mice fed SAT HFD (n = 7, filled bars, dashed lines filled circle) or PUFA HFD (n = 7, open bars, dashed lines open circle). Statistical calculations were based on individual area under the curve (AUC) values, calculated from 0 to 120 minute time points. Statistical analysis was done by 1-way ANOVA followed by two comparisons (SAT HFD vs. PUFA HFD) using Student's t-test, * p<0.05; ** p<0.01.

