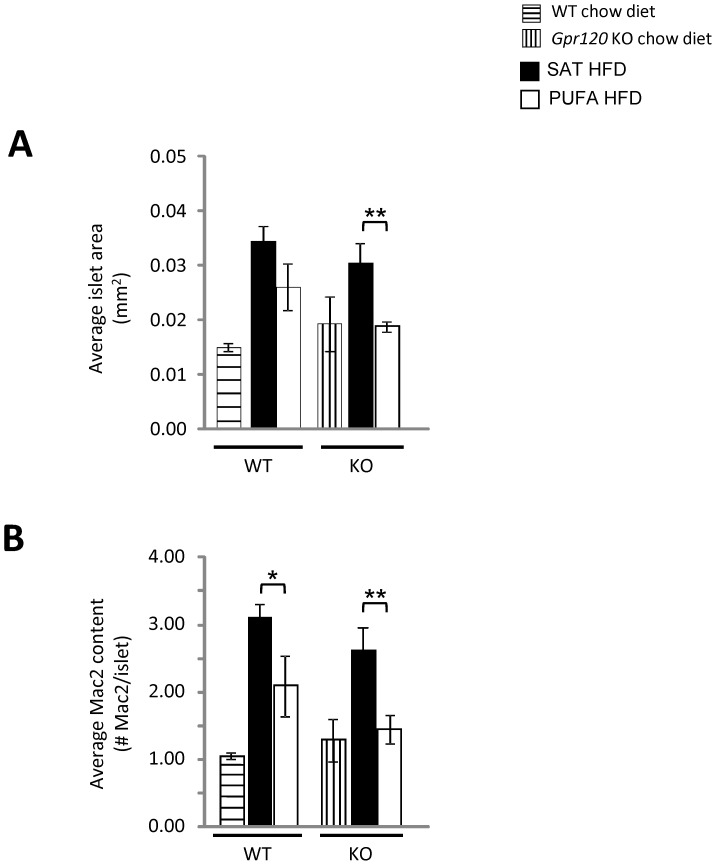
Figure 8. Pancreas histology.
A; Average islet area and B; macrophage content in WT (n = 3, horizontally lined bars) and Gpr120 KO (n = 3, vertically lined bars) fed chow diet, WT mice fed SAT HFD (n = 8, filled bars) and PUFA HFD (n = 8, open bars) and in Gpr120 KO mice fed SAT HFD (n = 7, filled bars) and PUFA HFD (n = 7, open bars). Statistical analysis was done by 1-way ANOVA followed by two comparisons using Student's t-test, SAT HFD vs. PUFA HFD, * p<0.05; ** p<0.01.

