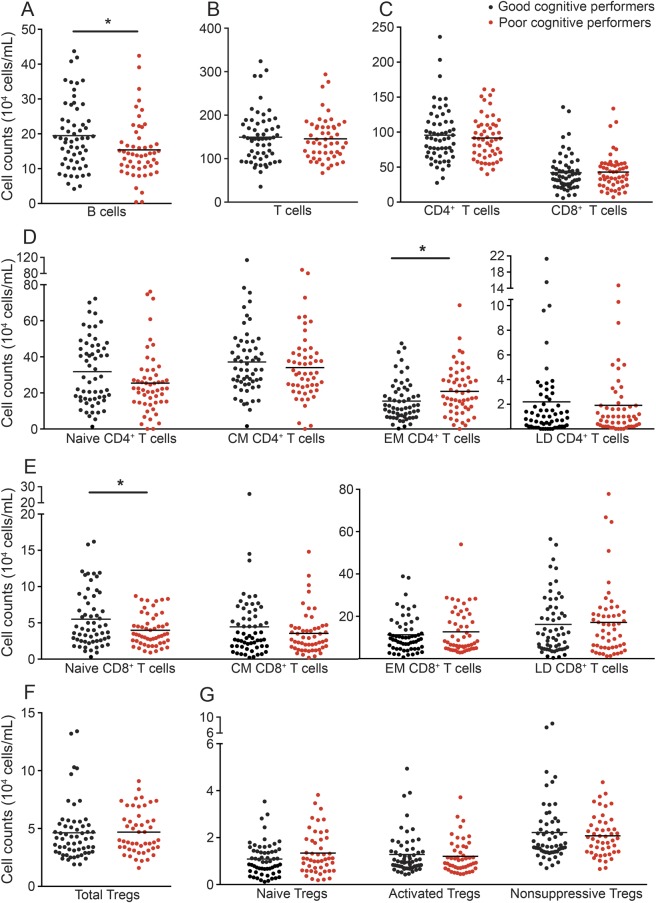
Figure 1. Distinct cognitive performers present differences in the cell populations of the adaptive immune system.
The profile (cell counts per mL of blood) of good (black) and poor (red) cognitive performers with regard to B cells (A); T cells (B); CD4+ and CD8+ T-cell subpopulations (C); CD4+ and CD8+T-cell compartments (D and E), subdivided as naive, central memory (CM), effector memory (EM), and late differentiated (LD) T cells; CD4+ regulatory T cells (Tregs) (F), subdivided as naive Tregs, activated Tregs, and nonsuppressive Tregs (G). Each dot represents one individual and the line represents the mean of the group. *p < 0.05.

