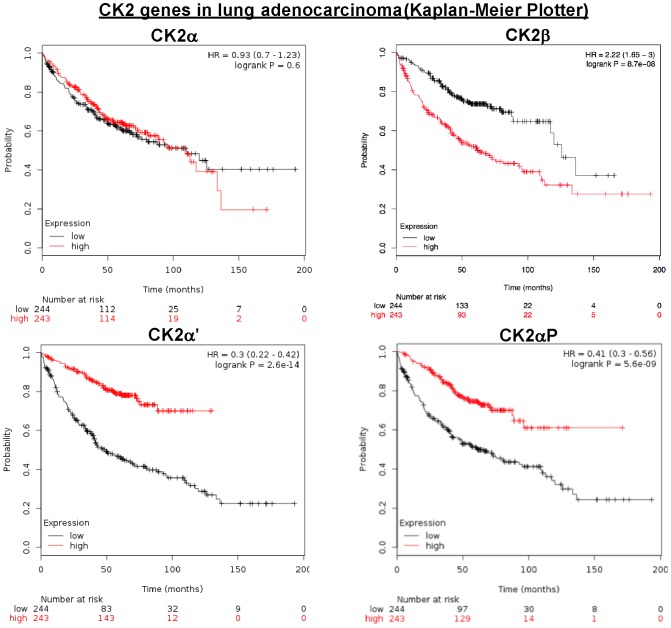
Figure 3. CK2 genes in lung adenocarcinoma (Kaplan-Meier Plotter).
Kaplan-Meier plots showing overall survival in lung adenocarcinoma. In red: patients with expression above the median and in black, patients with expressions below the median. CK2α, p = 0.6008; CK2αP, p = 5.6 10−9, CK2α', p = 2.6 10−14; CK2β, p = 8.7 10−8.

