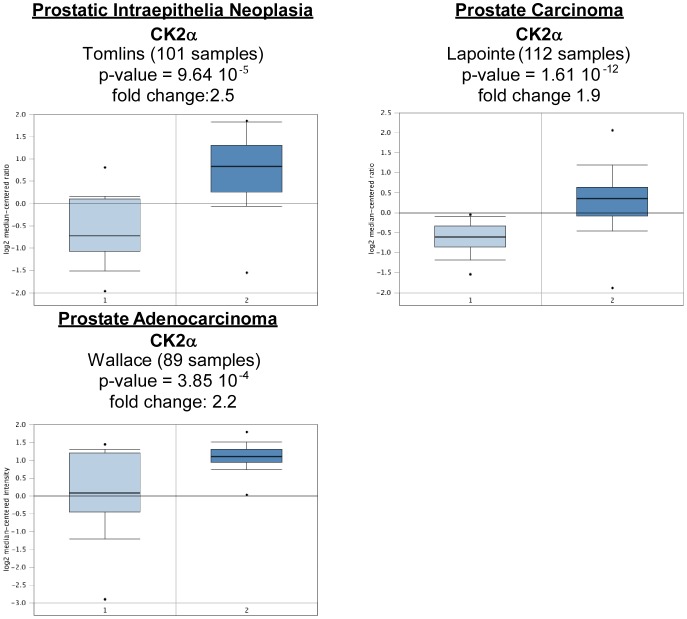
Figure 9. CK2α gene analysis in prostate cancer (Oncomine database).
Box plots derived from gene expression data in Oncomine comparing expression of CK2α gene in normal (left plot) and various types of prostate cancer tissue (right plot). Oncomine box plots were retrieved from various types of prostate cancer.

