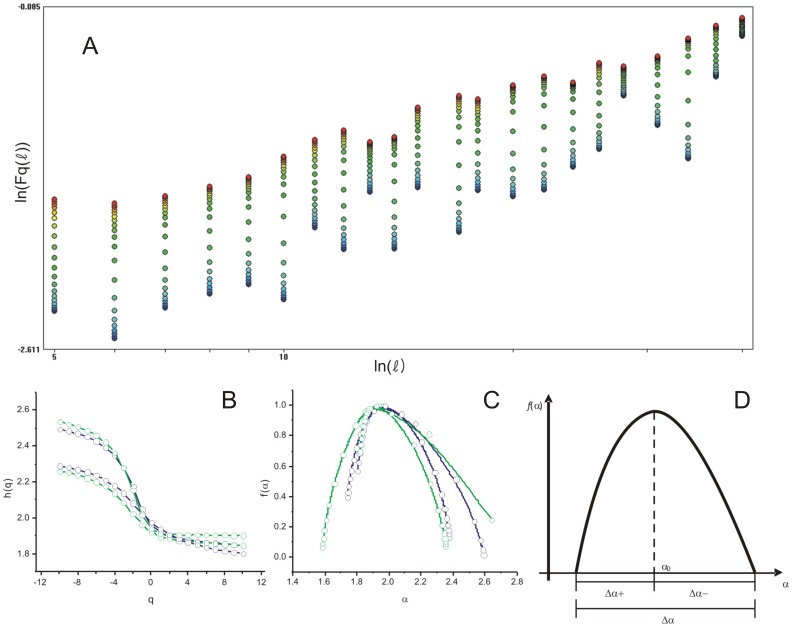
Figure 2. Multifractal plots derived from the MF-DFA of otolith periodic series.
(A) The linear regression between  and
and  . (B) The
  th moment versus the generalized exponent
  determined as the slope of (A). (C) The singularity spectra
  derived from the fluctuation contour of two M. merluccius (blue) and two M. curema (green) otoliths. (D) Schematic representation of the multifractal parameters extracted from the singularity spectrum.

