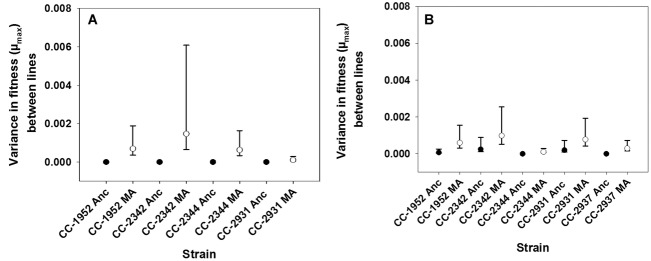
Figure 1.

zAmong-line variance in fitness for each strain in the first (A) and second (B) fitness assays. Black circles are the among-line variance component for the ancestral pseudolines for each strain, and white circles are the among-line variance component for the MA lines for each strain. Bars are 95% confidence intervals.
