
Figure 1.
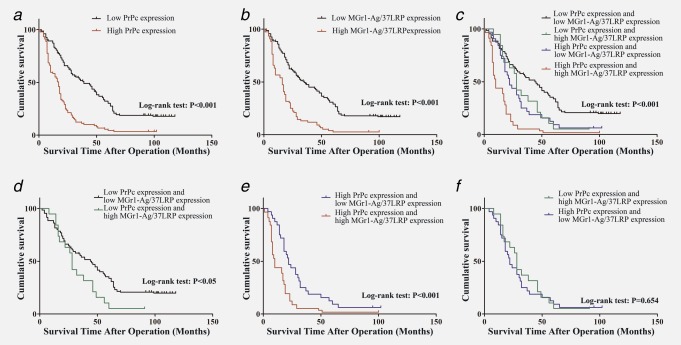
Kaplan-Meier analyses with a log rank test of survival. (a) Correlation of PrPc expression with overall survival (cum survival). (b) Correlation of MGr1-Ag/37LRP expression with overall survival. (c) Correlation of the combination of PrPc and MGr1-Ag/37LRP expression with overall survival. (d) Correlation of MGr1-Ag/37LRP expression with overall survival among patients with tumors of low PrPc expression. (e) Correlation of MGr1-Ag/37LRP expression with overall survival among patients with tumors of high PrPc expression. (f) Survival curves for patients with low PrPc/high MGr1-Ag/37LRP and high PrPc/low MGr1-Ag/37LRP. [Color figure can be viewed in the online issue, which is available at wileyonlinelibrary.com.]