
Figure 1.
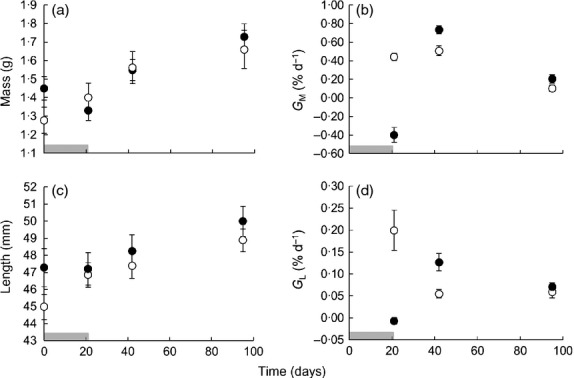
Growth trajectories in common minnows. Changes in: (a) total wet mass; (b) mass-specific growth rate (GM); (c) standard length; and (d) length-specific growth rate (GL) in common minnows fed either ad libitum throughout the entire 95-day study (control treatment; open circles), or food deprived for 21 days before being fed ad libitum for the remainder of the study [food-deprived (FD) treatment; dark circles]. In panels b and d, data points represent growth rates up until the day on which they are plotted, from the previous day point. Horizontal shaded bars represent the duration of food deprivation in the FD treatment.