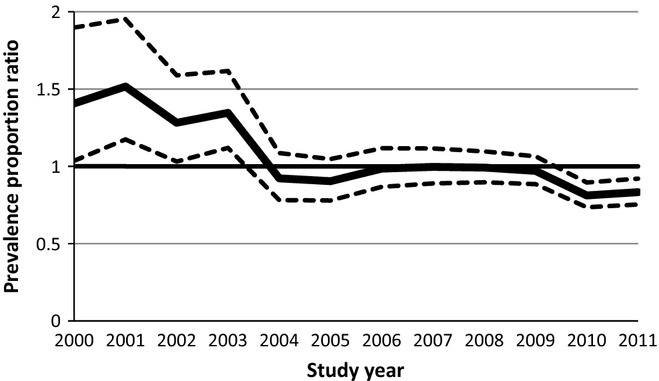
Figure 3.

Prevalence proportion ratios* with 95% confidence intervals (dashed lines), comparing the youngest (born October–December) with the oldest (born January–March) children in class, according to study year (July 1- June 30). *Prevalence proportion ratios are averaged over all grade levels (1st–6th) and calculated only for children on age-assigned grade level
