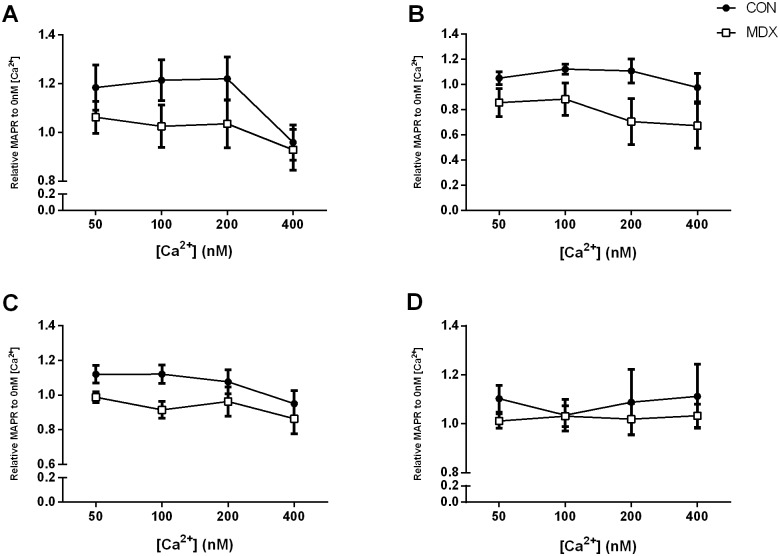
Figure 3. Relative MAPR of normal (control C57BL/10) and dystrophic mdx diaphragm following (A) pyruvate, palmitoyl carnitine, α-ketoglutarate and malate (PPKM) stimulation; (B) succinate and rotenone (S+R) stimulation; and TA following (C) PPKM stimulation; and (D) S+R stimulation across a 50–400 nM [Ca2+] range.
Data is expressed relative to MAPR at 0 [Ca2+] as mean ± SEM. *p<0.05 400 nM different from other [Ca2+]; n = 10 control & n = 10 mdx.

