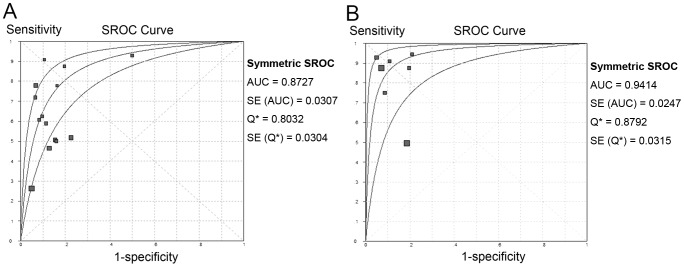
Figure 3. Summary of SROCs of spot signs on first-pass CTA or combined CT modalities for predicting hematoma expansion.
The curve is the regression line that summarizes the overall predictive accuracy. The upper and lower curves represent confidence intervals. Squares indicate individual study estimates of sensitivity and 1-specificity. The size of each square is proportional to the sample size of the corresponding study. Q*, the maximum joint sensitivity and specificity on a symmetric ROC curve; SE (AUC), standard error of AUC; SE (Q*), standard error of the Q* value. (A) first-pass CTA; (B) combined CT modalities.

