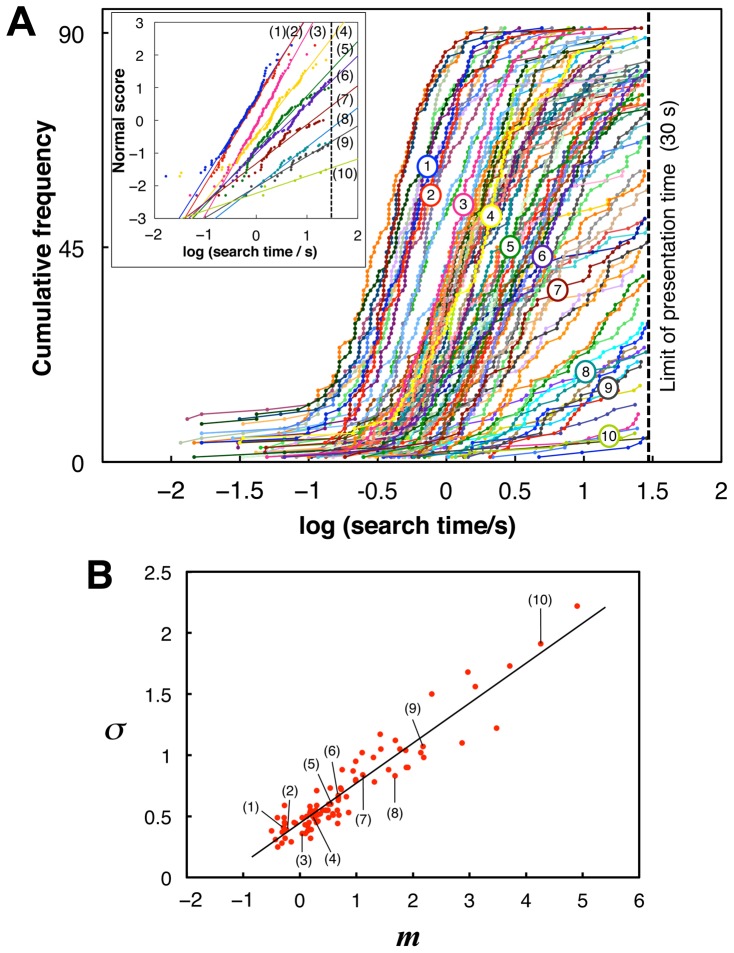
Figure 2. Distributions of search times across subjects.
(A) Cumulative distributions of logarithmic search times (obtained within the time limit) across subjects, each of which represents one of the 90 degraded images. Broken lines indicate the presentation time limit (30 s). Numerical labels from 1 to 10 indicate the example stimulus images from Fig. 1. Inset: normal probability plots of logarithmic search times versus normal scores for the example stimuli, each of which is optimally fitted by a line that represents a normal distribution. (B) Relationships between means, m, and SDs, σ, of the normal distributions fitted to logarithmic search time distributions for all stimuli of degraded images. The linear regression  provided the values
  and
and  . Thus, the time constant
  [s] in equation (1).

