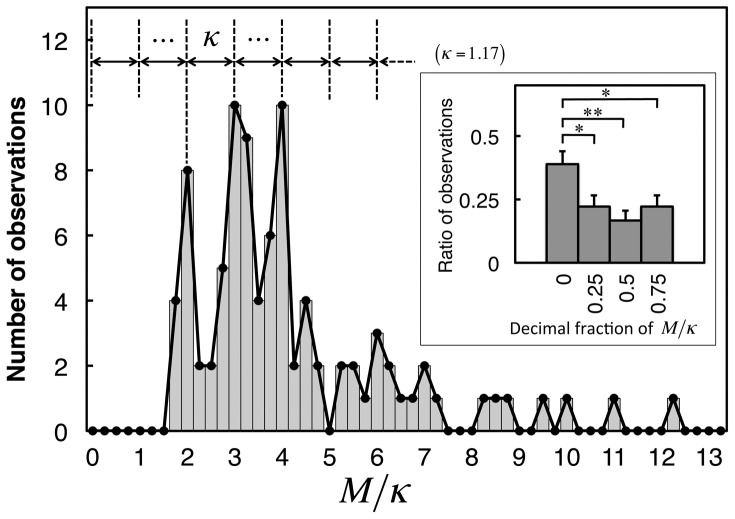
Figure 4. Histogram of image difficulty, M, scaled by distribution period, κ.
The period, κ, was determined to equal 1.17 by scanning from 0.5 to 5.0 at 0.01 intervals to maximize the observed frequency of the decimal fraction of M/κ in the interval  . Inset: ratios of observed decimal fractions (error bars indicate standard errors of means (SEM)). The ratio in the quarter interval centered at 0 was significantly larger than those at 0.25, 0.5, and 0.75 (paired, one-tailed z test for two population proportions [57], n = 90, *
 , **
, ** ).
).

