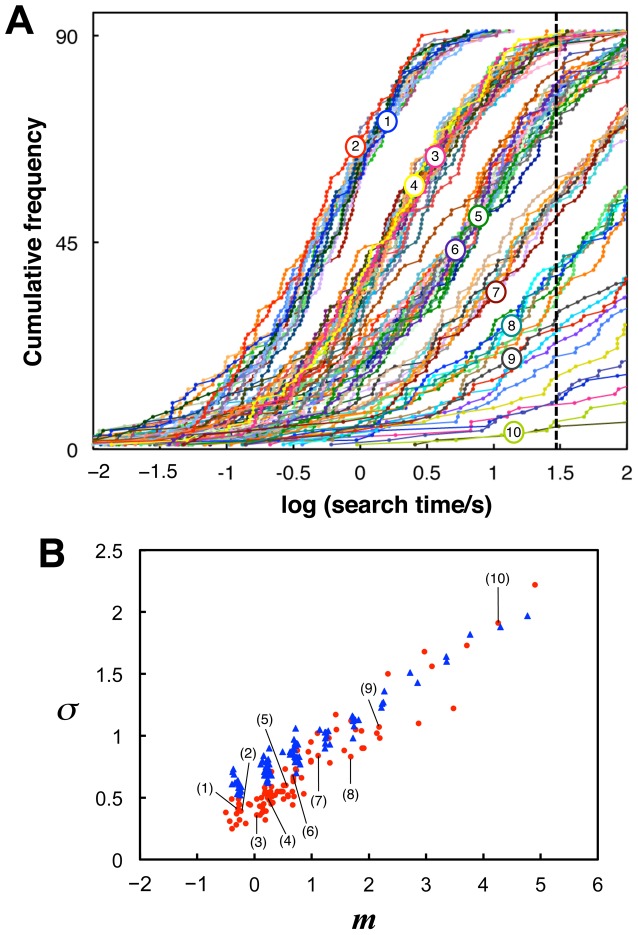
Figure 5. Monte Carlo simulations of the theoretical model.
(A) Cumulative distributions of logarithmic search times, defined as the time from search onset until coincidental activation of the missing components (see main text). The numbers of missing components, ν, for example stimuli (1) to (10) were 2, 2, 3, 3, 4, 4, 5, 6, 7, and 11, respectively. Broken line indicates the presentation time limit (30 s) used in the experiment. (B) Relationships between means and SDs of logarithmic search time distributions of the model results (blue triangles) in comparison with those of the experimental results (red dots; the same as in Fig. 2B, including labels for example stimuli).

