
Figure 6. Model-based corrections.
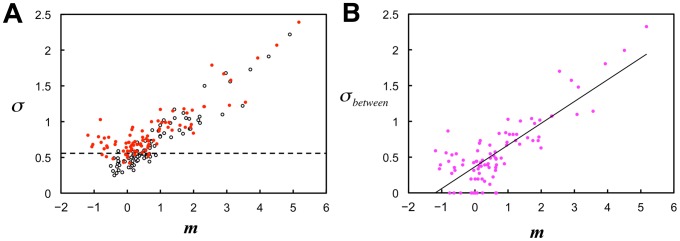
(A) Relationship between means and SDs of the distributions of logarithmic search times for all stimuli without and with the model-based interval correction. Original data without the interval correction (open black dots; the same as in Fig. 2B) reveals a substantial number of stimuli with SDs of less than the constant of within-subject SD ( = 0.557) indicated by the broken line, which is the theoretical minimum of the SD. The interval correction using reduction by 300 ms resulted in SDs effectively exceeding 0.557 (red dots) (see Material and Methods for details of the interval correction). (B) Relationship between means and between-subject SDs of the distributions of logarithmic search times. To obtain between-subject SD, σ between, the model-based SD correction, 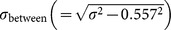 , was applied to the observed SD, σ, after the interval correction had been applied (see main text for the SD correction). Values of σ below 0.557 were converted to
  (12% of all data points). The linear regression equation
 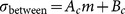 , which was applied to all data including those with
  , had an r
2 = 0.68,
, had an r
2 = 0.68,  , and
, and  .
.