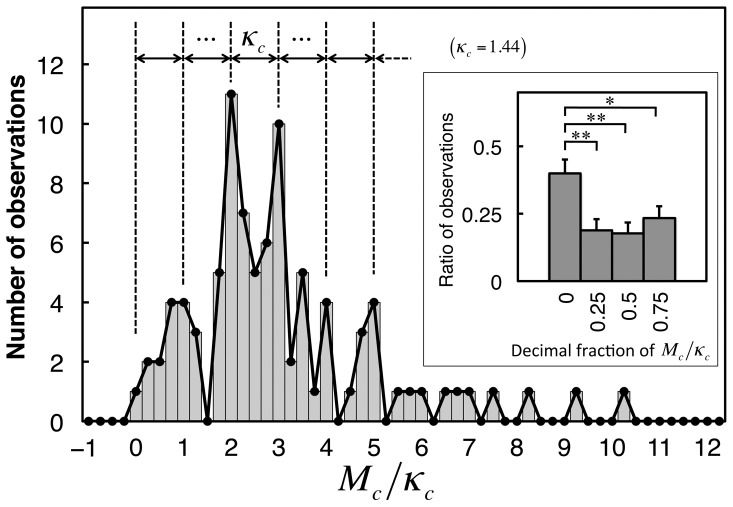
Figure 7. Histogram of image difficulty scaled by distribution period after application of the model-based corrections.
The period, κc, of the distribution of image difficulty, Mc, was determined to be 1.44 according to the same procedure as that in Fig. 4. Inset: ratios of observed decimal fractions of Mc/κc (error bars indicate SEM). The ratio in the quarter interval centered at 0 was significantly larger than those at 0.25, 0.5, and 0.75 (paired, one-tailed z test for two population proportions [57], n = 90, * , **
, ** ). Values of Mc/κc were rounded to the nearest natural numbers to be used as the numbers for the missing components, νc, in the model. Although the three smallest values of Mc/κc were rounded to
  , these were regarded as
  because the search times in case of
  should be zero after application of the interval correction but this was evidently not the case for their corresponding stimuli (Fig. 2A).

