
Figure 8. Relationships between means and SDs of search time distributions after application of the model-based corrections.
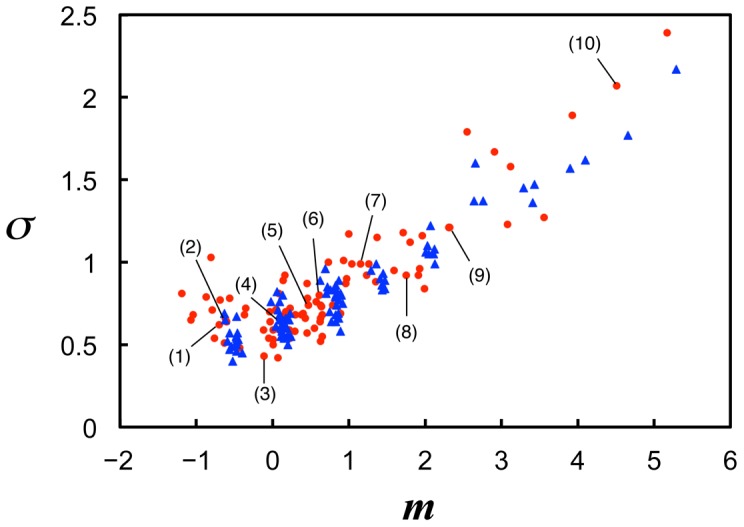
Relationships between means and SDs of logarithmic search times of the experimental results, which are shown by red dots in the same manner as in Fig. 6A with the labels for the example stimuli, and model results, which are shown by blue triangles, after application of the model-based corrections. The numbers of the missing components, νc, for example stimuli (1) to (10) were 1, 1, 2, 2, 3, 3, 4, 5, 6, and 9, respectively. The model-based corrections improved agreement between the experimental and model results with the SD differences observed before the corrections (Fig. 5B) being successfully eliminated.