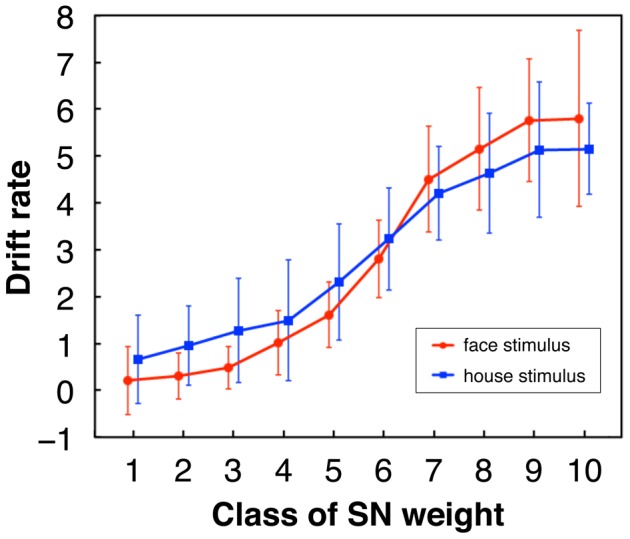
Figure 11. Means of estimated drift rates of the DDM averaged across subjects.

Drift rate of each subject was estimated for each class of the SN weight (see Materials and Methods). Error bars represent standard deviation. (All the distributions across subjects passed the Kolmogorov-Smirnov test for normality ( ).) Although the mean drift rates for house stimuli were estimated to be negative since the decision boundary for house was lower (i.e., at zero) in the DDM, they are plotted with the reversed signs here.
