
Figure 14. Subject's capability of PDM.
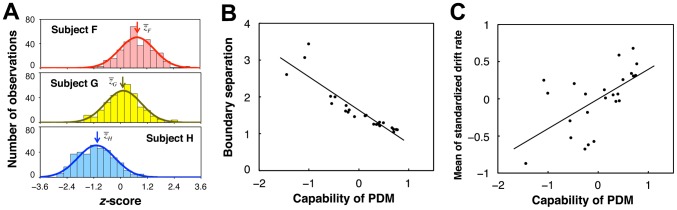
(A) Histograms of z-scores of three typical subjects whose mean z-scores were the second highest (Subject F,  ), median (Subjects G,
  ), and second lowest (Subject H,
  ) of all the subjects. Each bar has a bin width of 0.3. Each curve is a normal distribution with the same mean and SD as the histogram data. Mean z-scores significantly differed between subjects (unpaired, two-tailed t tests,
  versus
  :
:  ,
,  ;
;  versus
  :
:  ,
,  ). (B) Relationship between subject's capability of PDM and boundary separation. The capability was defined as the mean z-score of the subject (see main text). (C) Relationship between subject's capability of PDM and within-subject mean of drift rates each of which was standardized over subjects in a stimulus class of the SN weight.