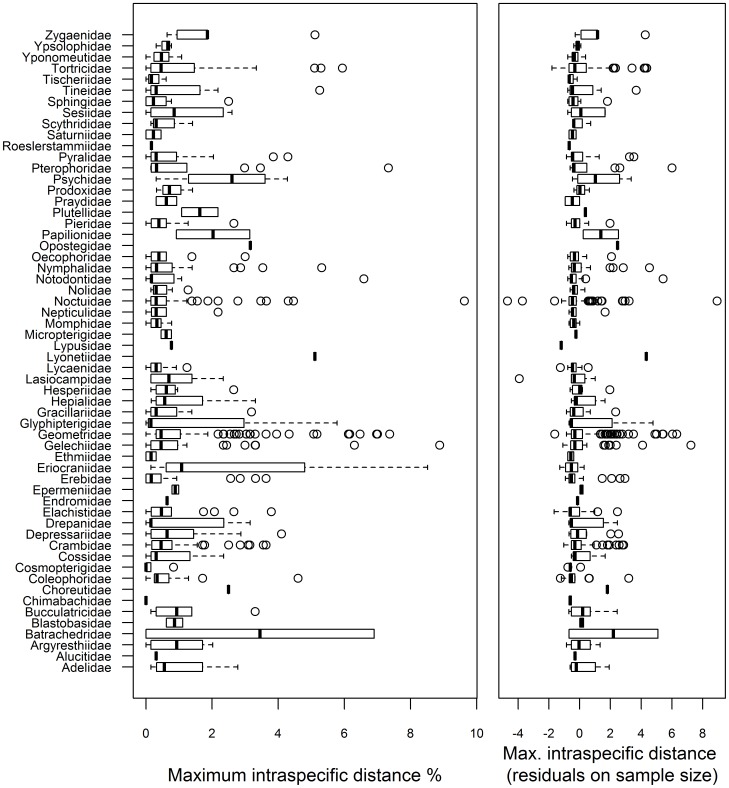
Figure 2. Maximum intraspecific distance for the COI barcode region for the species in each of the 58 families.
Left panel: Distributions of maximum intraspecific genetic distance values for each family. Right panel: Residuals from a regression of intraspecific distance against sample size per species, accounting for differences in sample size among species.

