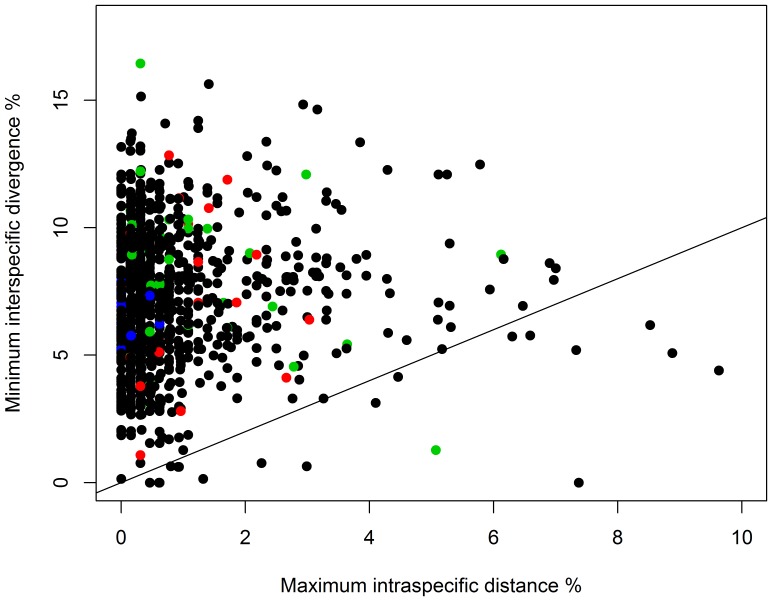
Figure 3. Maximum intraspecific distance (K2P) for COI plotted against minimum distances to the nearest neighbour (NN) species for the combined Austrian and Finnish data (5777 specimens, 1004 species).
The diagonal line represents cases where the maximum intraspecific distance equals the minimum distance to the NN. Colours represent different distribution categories (black: continuous; green: fragmented, red: disjunct, blue: migratory).

