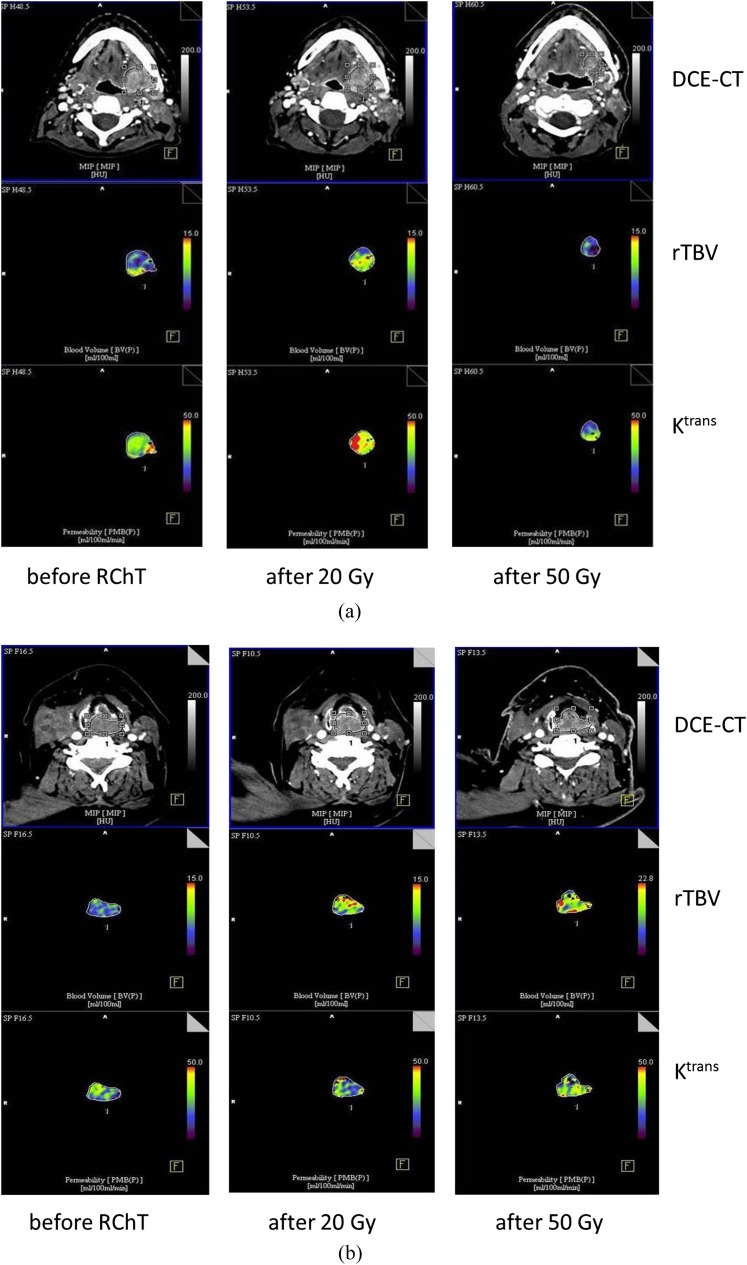
Figure 2.
(a) Dynamic contrast-enhanced CT (DCE-CT) colour-coded maps of relative tumour blood volume (rTVB) and transfer coefficient (Ktrans) before radiochemotherapy (RChT), and after 20 Gy and 50 Gy (responders group). (b) DCE-CT colour-coded maps of rTVB and Ktrans before RChT, and after 20 Gy and 50 Gy (non-responders group).

