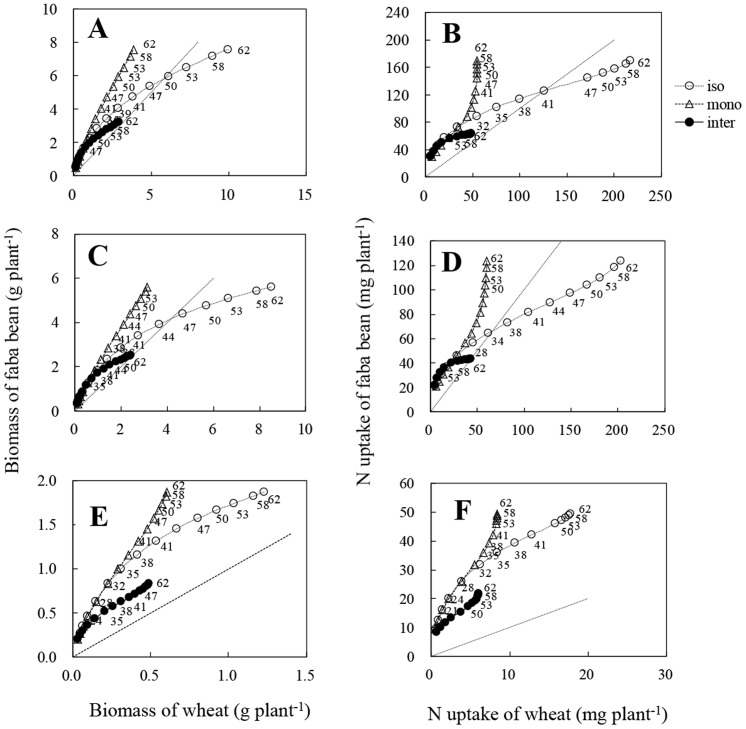
Figure 5. Trajectories of cumulative biomass production and cumulative nitrogen (N) uptake of total (A, B), shoot (C, D) and root (E, F) by isolated (iso: open circle and dashed curve), monocropped (mono: open triangles and dashed curve), intercropped (inter: solid symbols and continuous curve) wheat and according faba bean.
Data was derived from the logistic equation using the mean of actual data at each sampling. Numbers near the curves represent the samplings time (day). The dashed line shows the 1∶1 relationship between faba bean and wheat.

