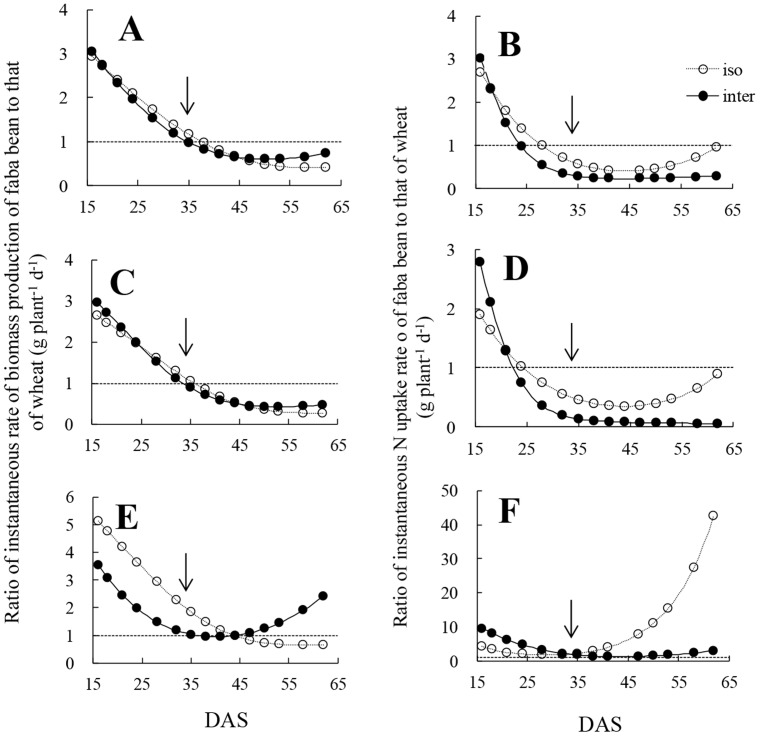
Figure 7. Ratio of instantaneous rate of biomass production of faba bean to that of wheat, and ratio of instantaneous nitrogen (N) uptake rate of faba bean to that of wheat in total (A, B), shoot (C, D) and root (E, F).
Two lines in each graph indicate isolated (iso: open circle and dashed curves), intercropped (inter: solid symbols and continuous curves) wheat and according faba bean. The dashed lines indicate the y = 1. The arrows mean the date (33 DAS) of wheat stem elongation.

