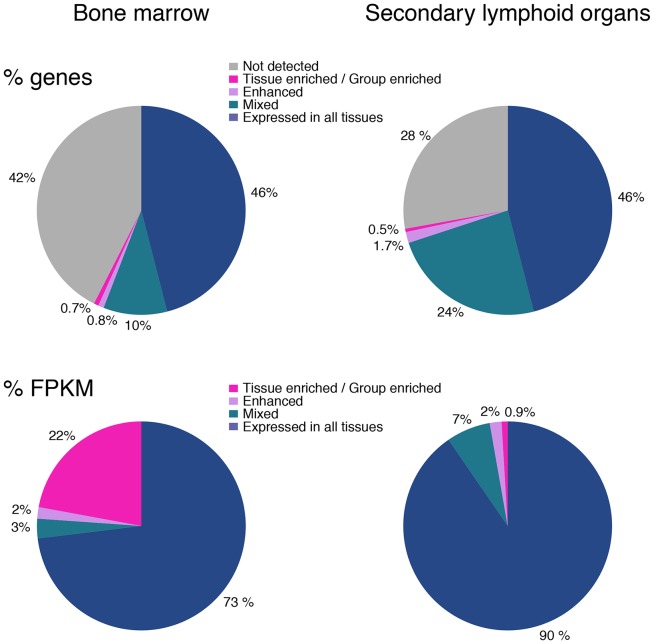
Figure 2. Pie charts displaying the expression profiles for the lymphohematopoietic tissues.
The upper panel shows the percentage of genes expressed within the different categories of expression, for bone marrow and for the secondary lymphoid organs respectively. The lower panel pie charts show the percentage of transcripts (FPKM) for each category.

