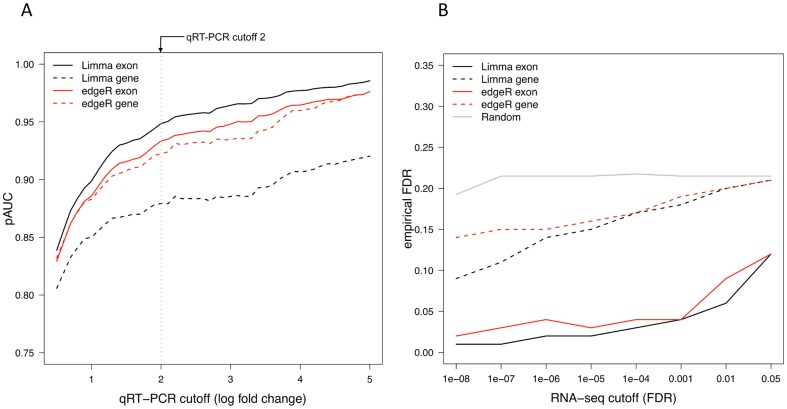
Figure 2. Comparison of the gene- and exon-based strategies in terms of qRT-PCR-derived gold standard in the MAQC data.
Following the approach in [27], we considered a gene as a gold standard negative if its absolute log fold change in the qRT-PCR data was less than 0.2 and as a gold standard positive if its absolute log fold change in the qRT-PCR data was above a predefined cutoff value. (A) Partial area under the ROC curve (pAUC, y-axis) at various qRT-PCR cutoff values with increasing stringency were considered between 0.5 and 5 with increments of 0.1 (x-axis). At each cutoff, the performance of each method was assessed in terms of their receiver operating characteristic (ROC) curves and the corresponding partial areas under the curves (pAUC) at specificity of 0.8 (y-axis). (B) The empirical false discovery rate (empirical FDR, y-axis) as a function of different FDR cutoffs for the RNA-seq data (x-axis), using the qRT-PCR gold standard log fold change cutoff of 2 to determine the qRT-PCR gold standard positives. Genes with log fold change below 0.2 in the RNA-seq data (x-axis) were filtered out prior to determining the empirical FDR. To calculate the random curve, for each method and cutoff an equal number of genes was randomly selected to the result list and compared against the gold standard positive and gold standard negative gene lists. The results were then averaged across the randomizations.

