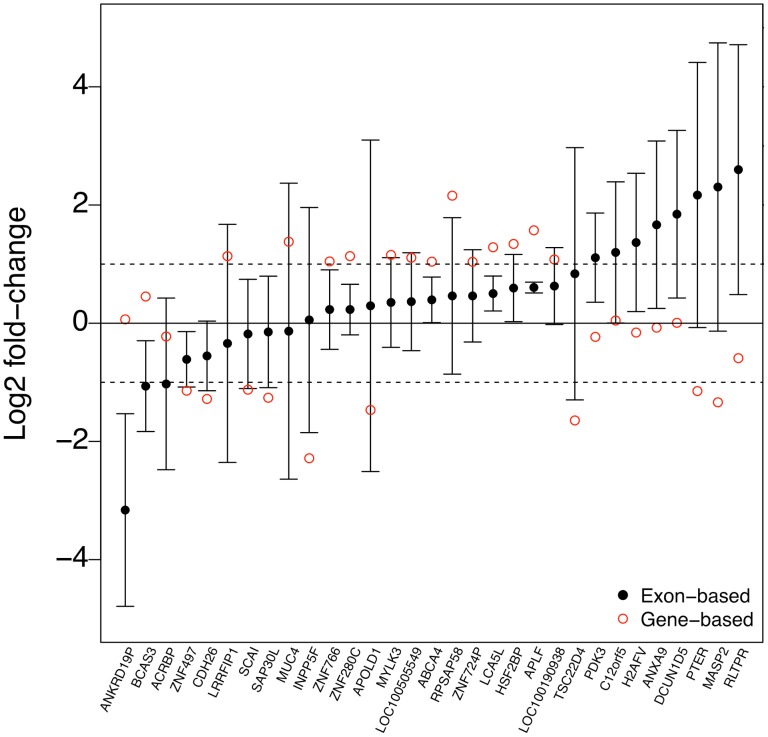
Figure 3. Robustness against single exons.
Exon-wise and gene-based log fold changes for 31 genes in the MAQC data that showed largest differences between the gene- and exon-based strategies. The black dots and error bars show the median and standard deviation of the exon-level values, respectively; the red open circles are the corresponding gene-based values. We selected here genes with more than three exons, a fold change above 2 and p-value (or median p-value) below 0.05 with either of the strategies and fold change to the opposite direction or p-value difference above 0.1 with the other strategy, according to the values calculated with the limma software package. Among these genes, only MASP2 contained measurements also in the qRT-PCR data and they supported well the exon-based result (log2 fold-change of 1.85 in the qRT-PCR data), further confirming the utility of the exon-based strategy.

