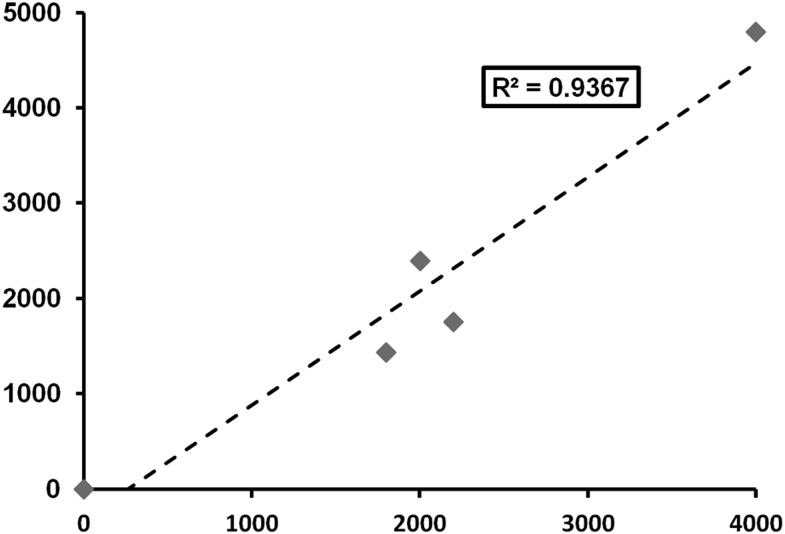
Figure 2.
Increased R2 value owing to clustering of data points. Deviations (as a percentage) are identical to those in Figure 1 (left). The data points used for this graph were determined for the purpose of illustration, that is, they are not the result of experimentation.

