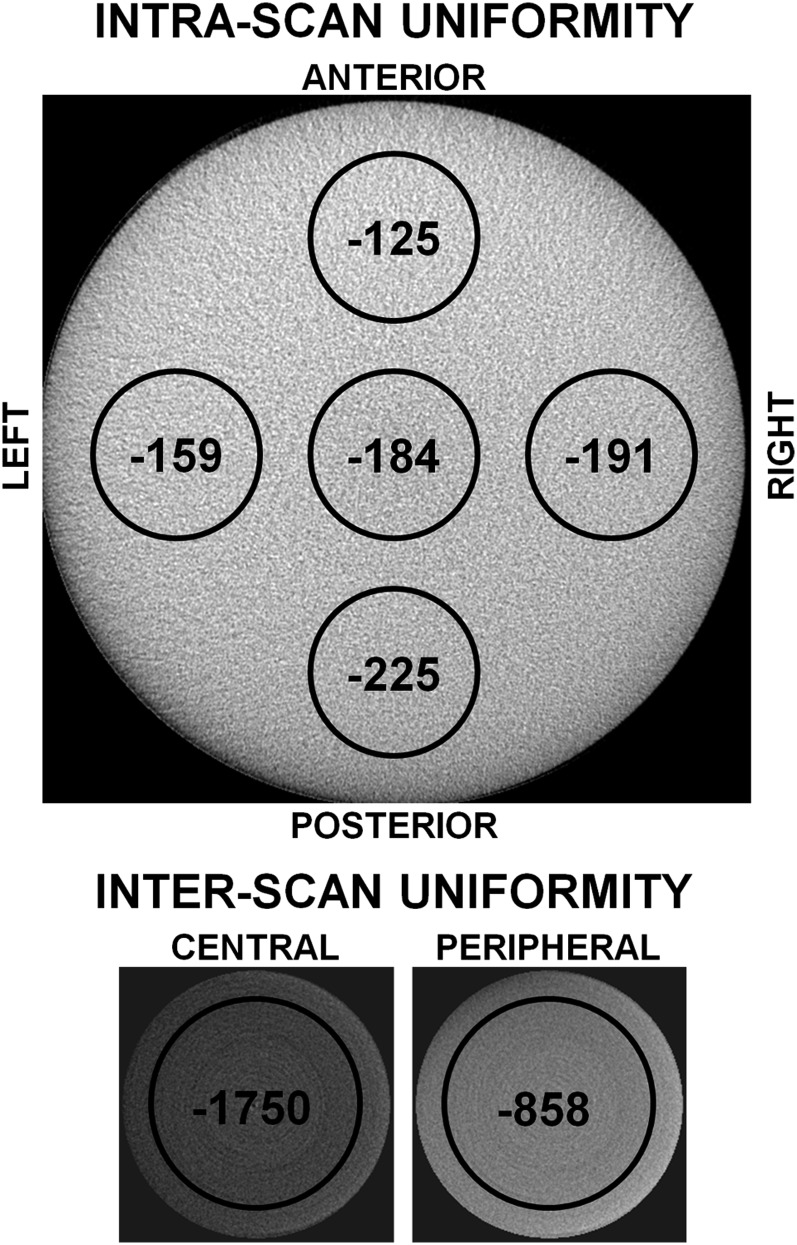
Figure 3.
Uniformity issues in CBCT, measured using a 160-mm homogeneous polymethyl methacrylate phantom. Each black circle shows the mean gray value inside it. Top: intrascan uniformity, showing differences in gray values between central and peripheral regions for a large-diameter (160 mm) CBCT scan. Bottom: interscan uniformity, showing differences between central and peripheral field of view positions for a small-diameter (50 mm) CBCT scan. The bottom two images are displayed using the same window/level settings. All images are to scale.

