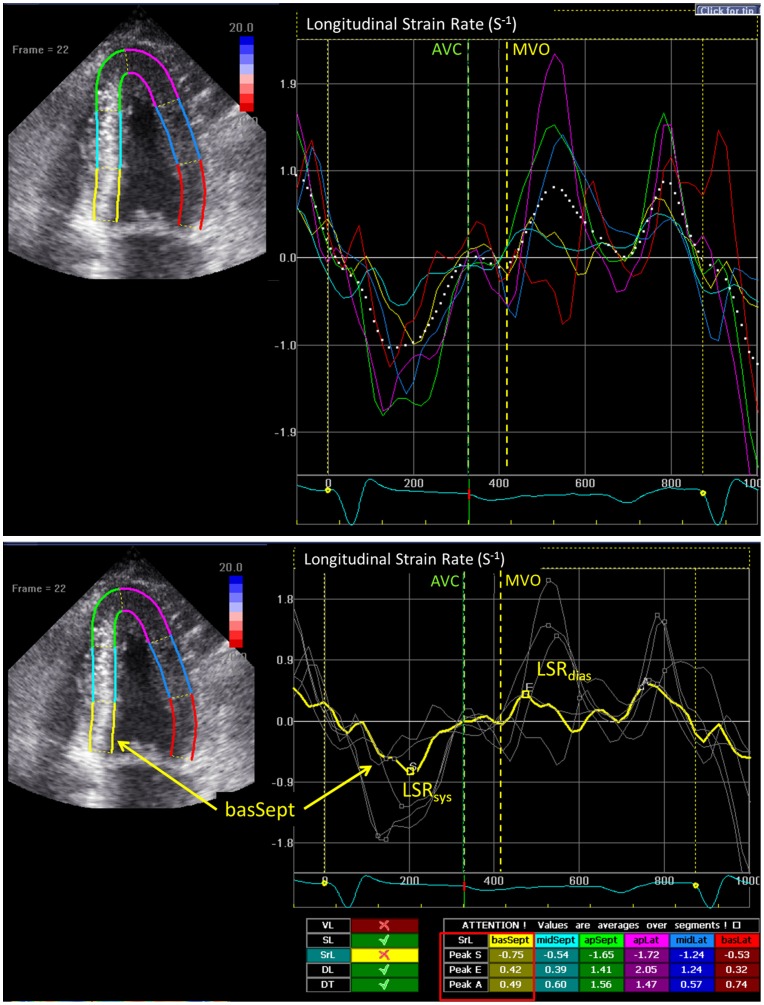
Figure 1. Examples for the measurement of longitudinal peak early diastolic strain rate (LSRdias) from two-dimensional speckle tracking imaging.
On the upper panel, solid colored lines indicate corresponding segmental strain rate curves and white dashed line indicates global strain rate curve. The measurements of longitudinal systolic strain rate (LSRsys) and LSRdias in the basal-septal segment are shown (yellow line) on the lower panel. AVC: aortic valve closure; MVO: mitral valve opening.

