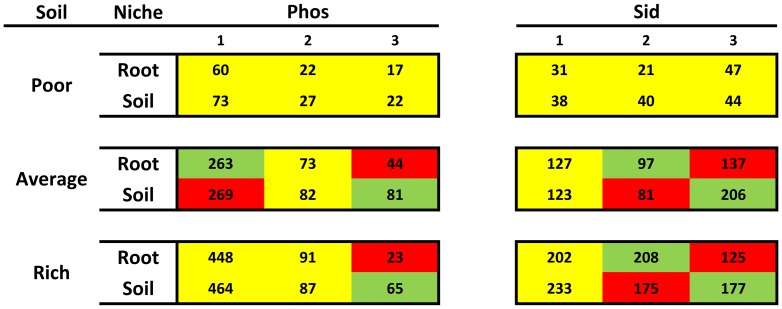
Figure 6. Heat map associations of the TCP solubilization and siderophores production abilities of endophytic (root) and rhizospheric (soil) isolates under each individual soil condition.
Phos = TCP solubilization, and Sid = siderophores production. 1 = no halo, 2 = small or average halo, and 3 = large halo. The red cells = less isolates than expected under those conditions, the green cells = excessive number of isolates under those conditions, and the yellow cells = no significant differences between the observed and expected values. Percentages and residuals are shown in S3 Fig. Sample sizes and p values are presented on S3 Table.

